The Binarly Transparency Platform does not require source code access and instead works directly on the binary. Once it detects a vulnerable or dangerous code pattern it will include the decompiled representation of the affected function in the finding evidence. This decompiled code will likely differ from the source, simply because function and variable names as well as comments and type information are discarded at compile time. To ease mapping findings back to the original source code, the Binarly Transparency Platform can utilize debugging symbols to include the correct function names.

Applying Debug Information

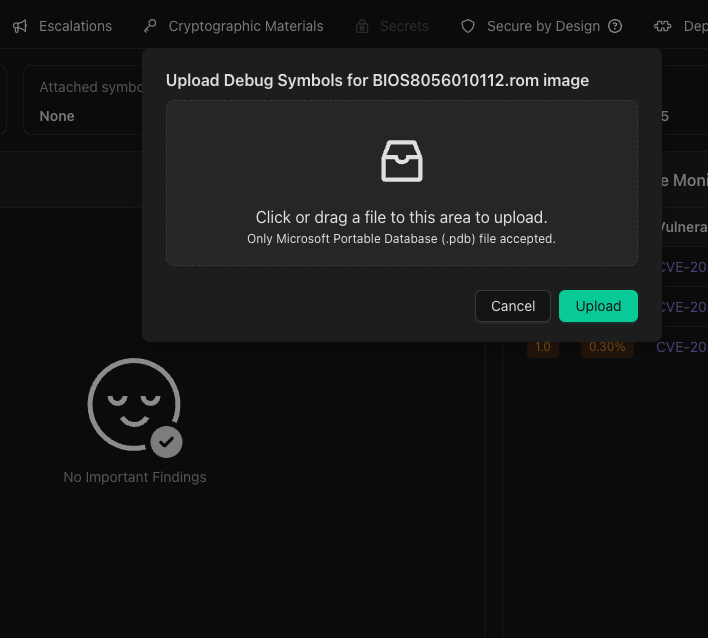
Debugging symbols are metadata embedded in or associated with compiled binaries that include some of the information that is discarded during compilation, including original function names. BTP supports loading embedded DWARF for Linux-based images as well as separate PDB symbol files for UEFI binaries. The latter need to be uploaded to the image using the symbol upload button on the image dashboard shown below.
PDB upload button on the overview tab.

PDB upload button on the overview tab.

Select a PDB file and press Upload.

Select a PDB file and press Upload.

The PDB file is verified to include information for the image and then applied. To ensure the new information is used, issue a rescan of the binary using the Rescan Button (shown below).
The rescan button is in the context menu on the image dashboard.

The rescan button is in the context menu on the image dashboard.

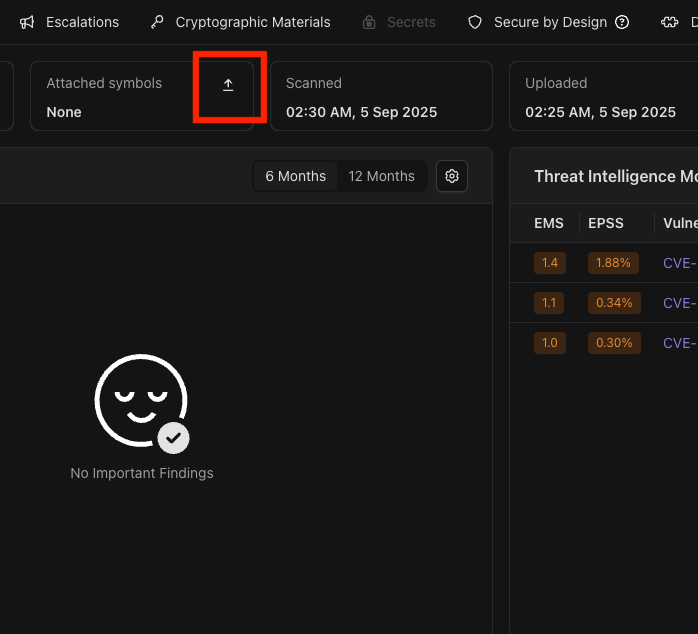
Use Debug Information

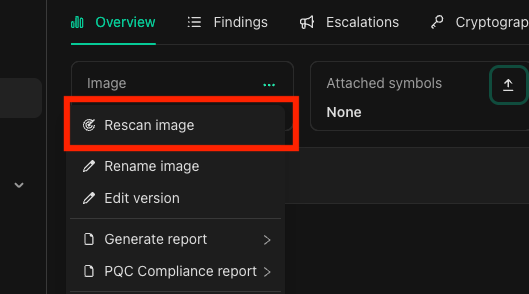
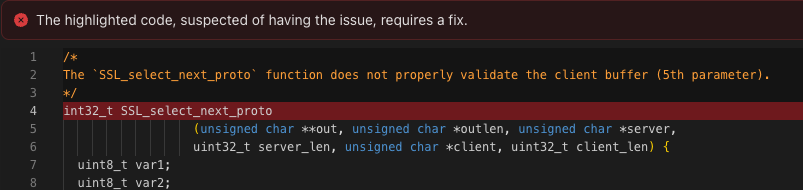
Once the scan is finished, findings that include decompiled code snippets in their evidence will show the original function names if it’s included in the uploaded PDB file like in the example below.
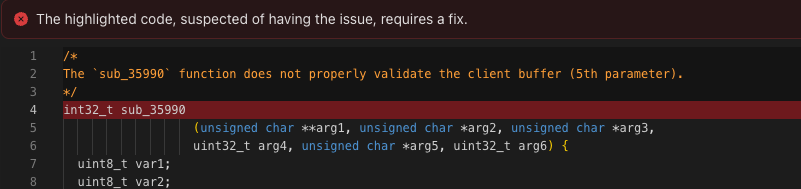
Evidence with auto generated function name.

Evidence with auto generated function name.

Evidence with original function name.

Evidence with original function name.