

Why a new risk score
Single-metric scoring forces a trade-off. CVSS describes severity but says nothing about whether a vulnerability is being exploited. EPSS predicts exploitation but ignores impact and reachability. A KEV listing is a strong signal but only a yes or no. Ranking findings in a production firmware image means weighing all of these at once, and weighing them differently depending on who is asking. BRS is built around four goals:- Transparency. Every metric, weight, and calculation step is visible and reproducible.
- Configurable emphasis. Profiles re-weight the taxonomy groups for different workflows; you select the profile that matches your task.
- Data flexibility. The score uses publicly available data where it exists and Binarly research data where it does not, and new metrics can be added without reworking the formula.
- Finding-type coverage. The same model prioritizes known CVEs, unknown UEFI vulnerabilities, secrets, mitigation failures, cryptographic weaknesses, malicious code, supply-chain issues, and hardening weaknesses.
How the score is built
Each metric belongs to one of four taxonomy groups. Every group produces a weighted subscore, and the four subscores are blended into the final result.
The Name group replaces the earlier “kind” concept. The finding name (for example
mitigation/uefi/untrusted-ami-test-key) is matched against a table of prefixes by longest-prefix match, so mitigation/uefi/untrusted-ami-test-key resolves to its exact entry while an unlisted mitigation/uefi/... name falls back to the closest parent prefix. The matched value scales the score up or down for that class of finding. A few classes carry negative values, which pull the score down when the finding type is inherently low-risk.
Scoring profiles
The platform ships three profiles. You select one from the Risk Score selector in the findings grid; the three share the same metrics and differ only in how much weight each taxonomy group carries. The alpha columns below are the group weights () each profile applies.
The profiles were renamed for clarity: Exploitation is now Exploitability, and Decision Impact is now Actionable Risk. The findings grid shows the current names. Exploitation leans on the Exploitation group; Decision Impact leans on the Decision and Impact groups.
Profiles change only the ranking emphasis, not the underlying data. The same finding keeps all of its metric values across profiles, so switching profiles reorders findings rather than rescanning them.
What a profile contains
A profile is a configuration with two parts:- Alphas (): how much each taxonomy group contributes to the final score. The four alphas (exploitation, impact, decision, name) sum to 1.
- Weights: per finding category, how much each metric contributes inside its group. A weight is between 0 and 1, and a weight of 0 disables the metric for that category.
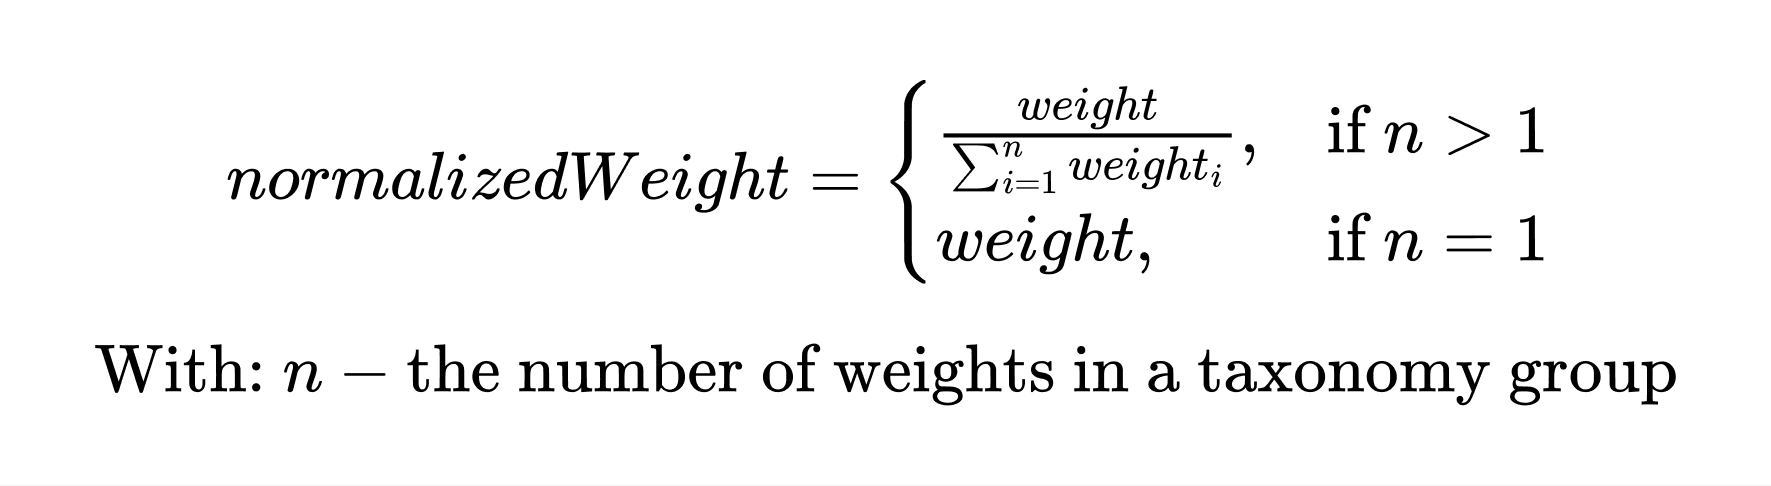
Per-group weight normalization.
The formula
The score is a weighted sum over the four groups, clamped to the range 0 to 1: where, for each group in :- is the profile alpha for the group.
- is the redistribution scale for the group (defaults to 1, see Weight redistribution).
- is the normalized value of metric , in the range 0 to 1. A missing metric contributes 0.
- is the profile weight for metric in the group, already normalized per group (see What a profile contains). A weight of 0 disables the metric for that finding category.
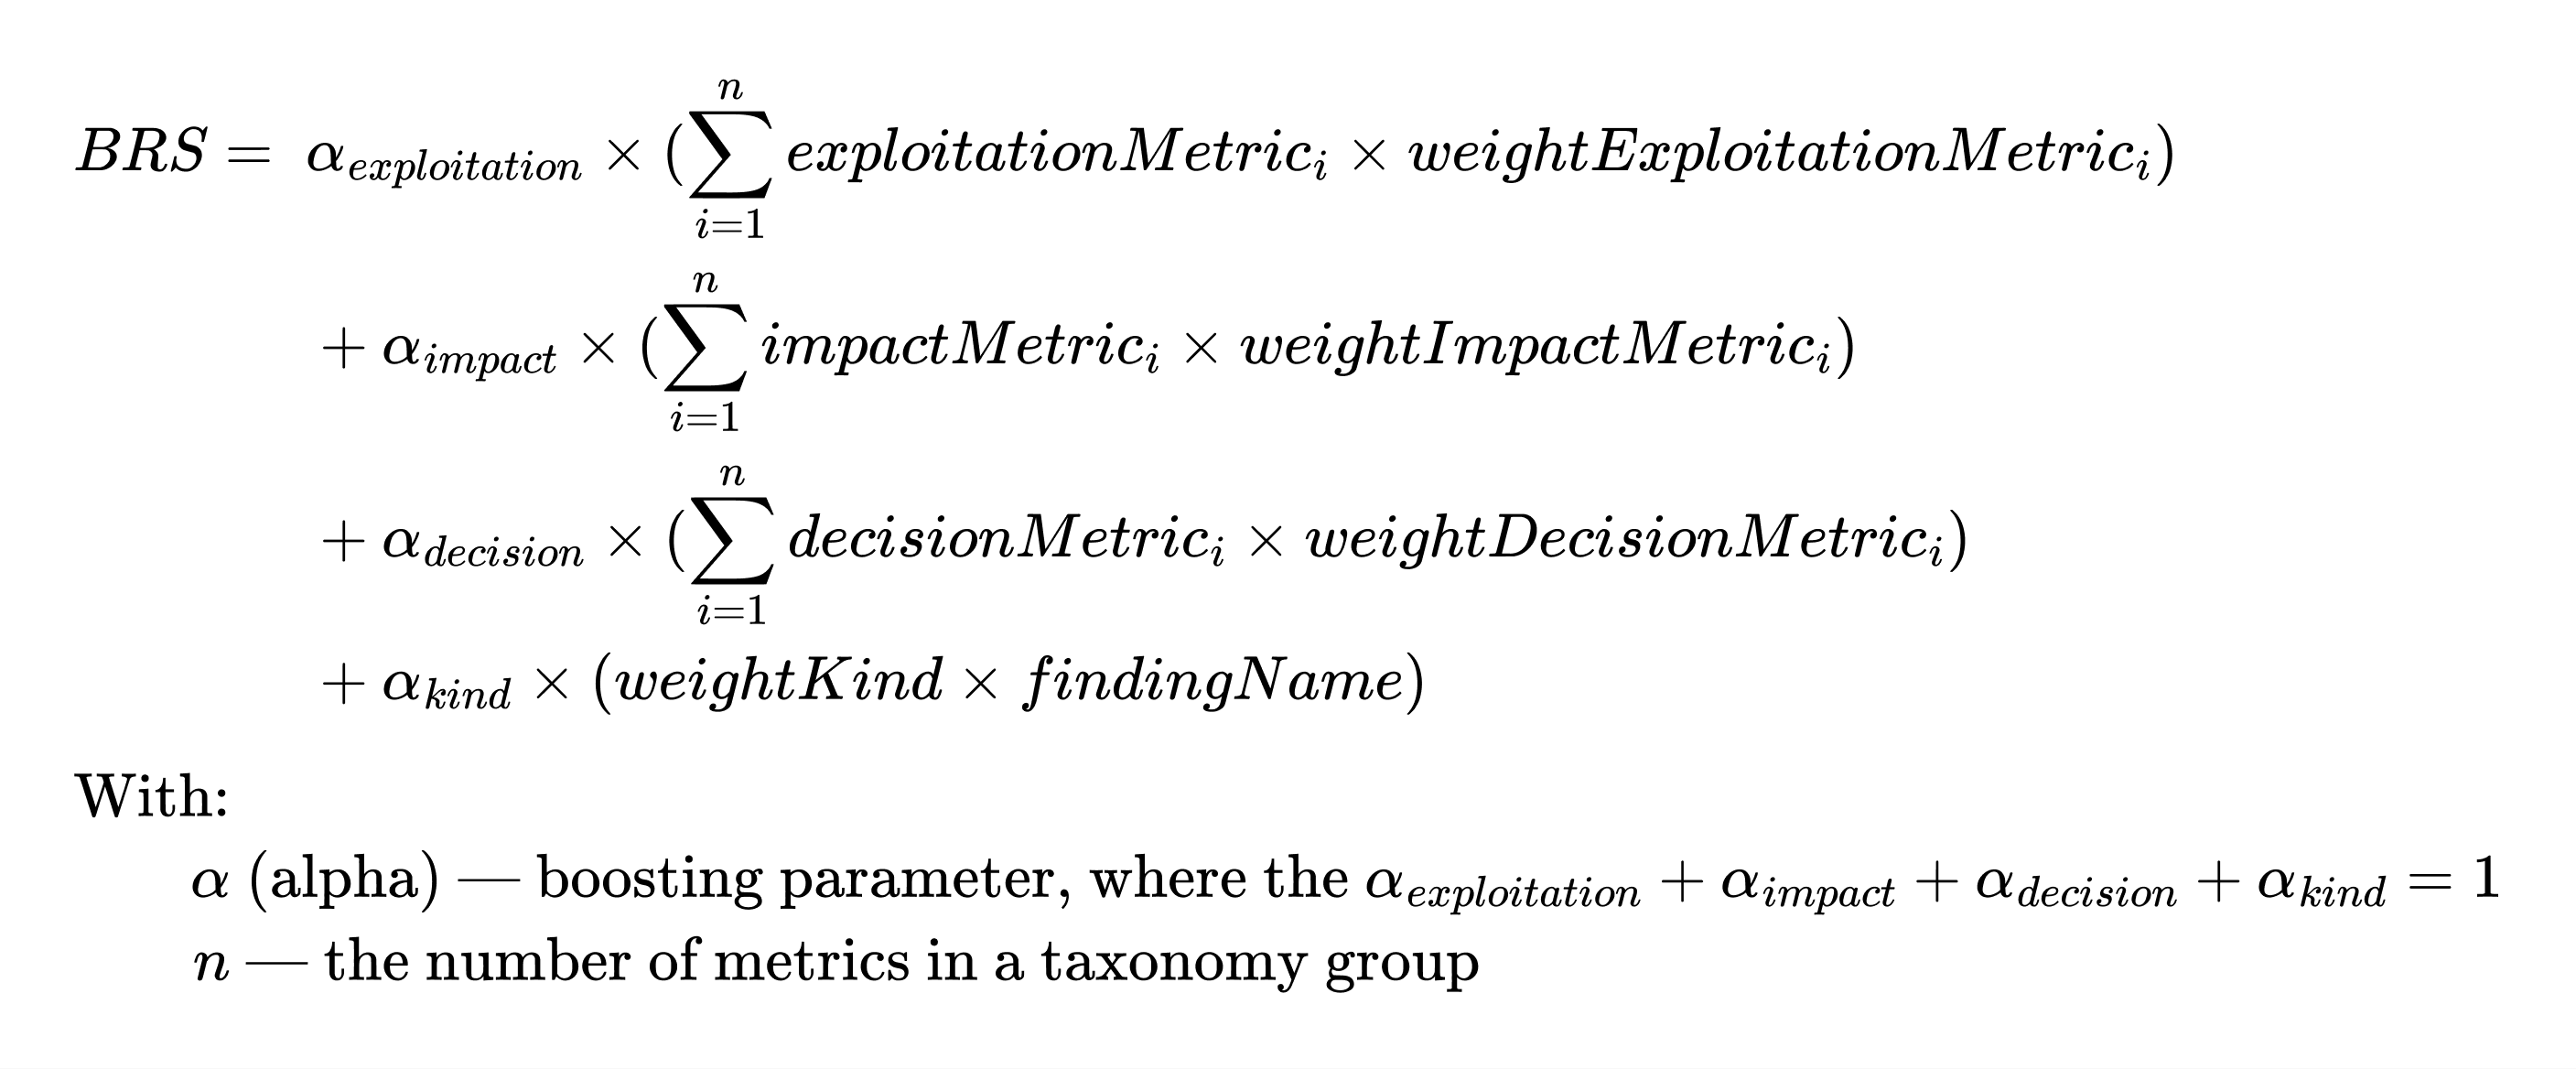
The Binarly Risk Score formula. The diagram labels the fourth group Kind; the platform now calls it the Name group.
Metric normalization
Every metric is reduced to a value between 0 and 1 before it enters the formula:- Ratios (CVSS base, CVSS exploitability, CVSS impact, EMS) are divided by 10. CVSS uses the highest of the available v2, v3, and v4 scores.
- Probabilities (EPSS, LEV, confidence, reachability confidence) are used directly.
- Booleans (KEV, public exploit, public PoC, verified exploit, weaponized exploit, SSVC Automatable, known fixed version, not disputed) map to 1 for true and 0 for false.
- Enumerations (severity, reachability kind, SSVC states, finding name) map to fixed values from the appendix tables.
A finding can have several reachability results. BRS selects the single entry with the highest
kind value * confidence product, the most reachable path, and uses its kind and confidence. Environment reachability is selected the same way from its own set.Weight redistribution
Not every finding has a value for every metric, usually because the source data does not exist. Treating a missing metric as 0 would silently discard both the metric and its weight, dragging strong findings down for reasons that have nothing to do with risk. Instead, the weight of a missing metric is partly redistributed to the metrics that do have values in the same group. Each metric has a recoverability factor between 0 and 1 that controls how much of its weight is donated when it is missing. A factor of 1 means the metric’s signal is well represented by its neighbors, so its weight moves over in full; a factor of 0 means nothing is donated. For a group and finding category , the redistribution scale is: where is the recoverability factor for metric in category (see Redistribution factors). Because the donated weight is shared in proportion to the surviving weights, the whole group scales by one factor rather than rewriting each weight individually. When a group has no surviving metrics (), its scale is 1 and the group contributes 0.Reading the score
The result is a value between 0 and 1. The platform presents it as a percentile, so a finding scoring higher than most others appears at the top of the list. There are no fixed severity bands: you sort and filter on the score directly rather than mapping it to a label. You do this from the Risk Score column in the findings grid, covered in Prioritizing with the Risk Score.Metrics reference
All metrics that can feed the score, grouped by taxonomy. Values are normalized to 0 to 1 as described above.Exploitation metrics
Impact metrics
Decision metrics
Name metric
Metrics by finding type
The metrics the shipped profiles weight for each finding type, grouped by taxonomy.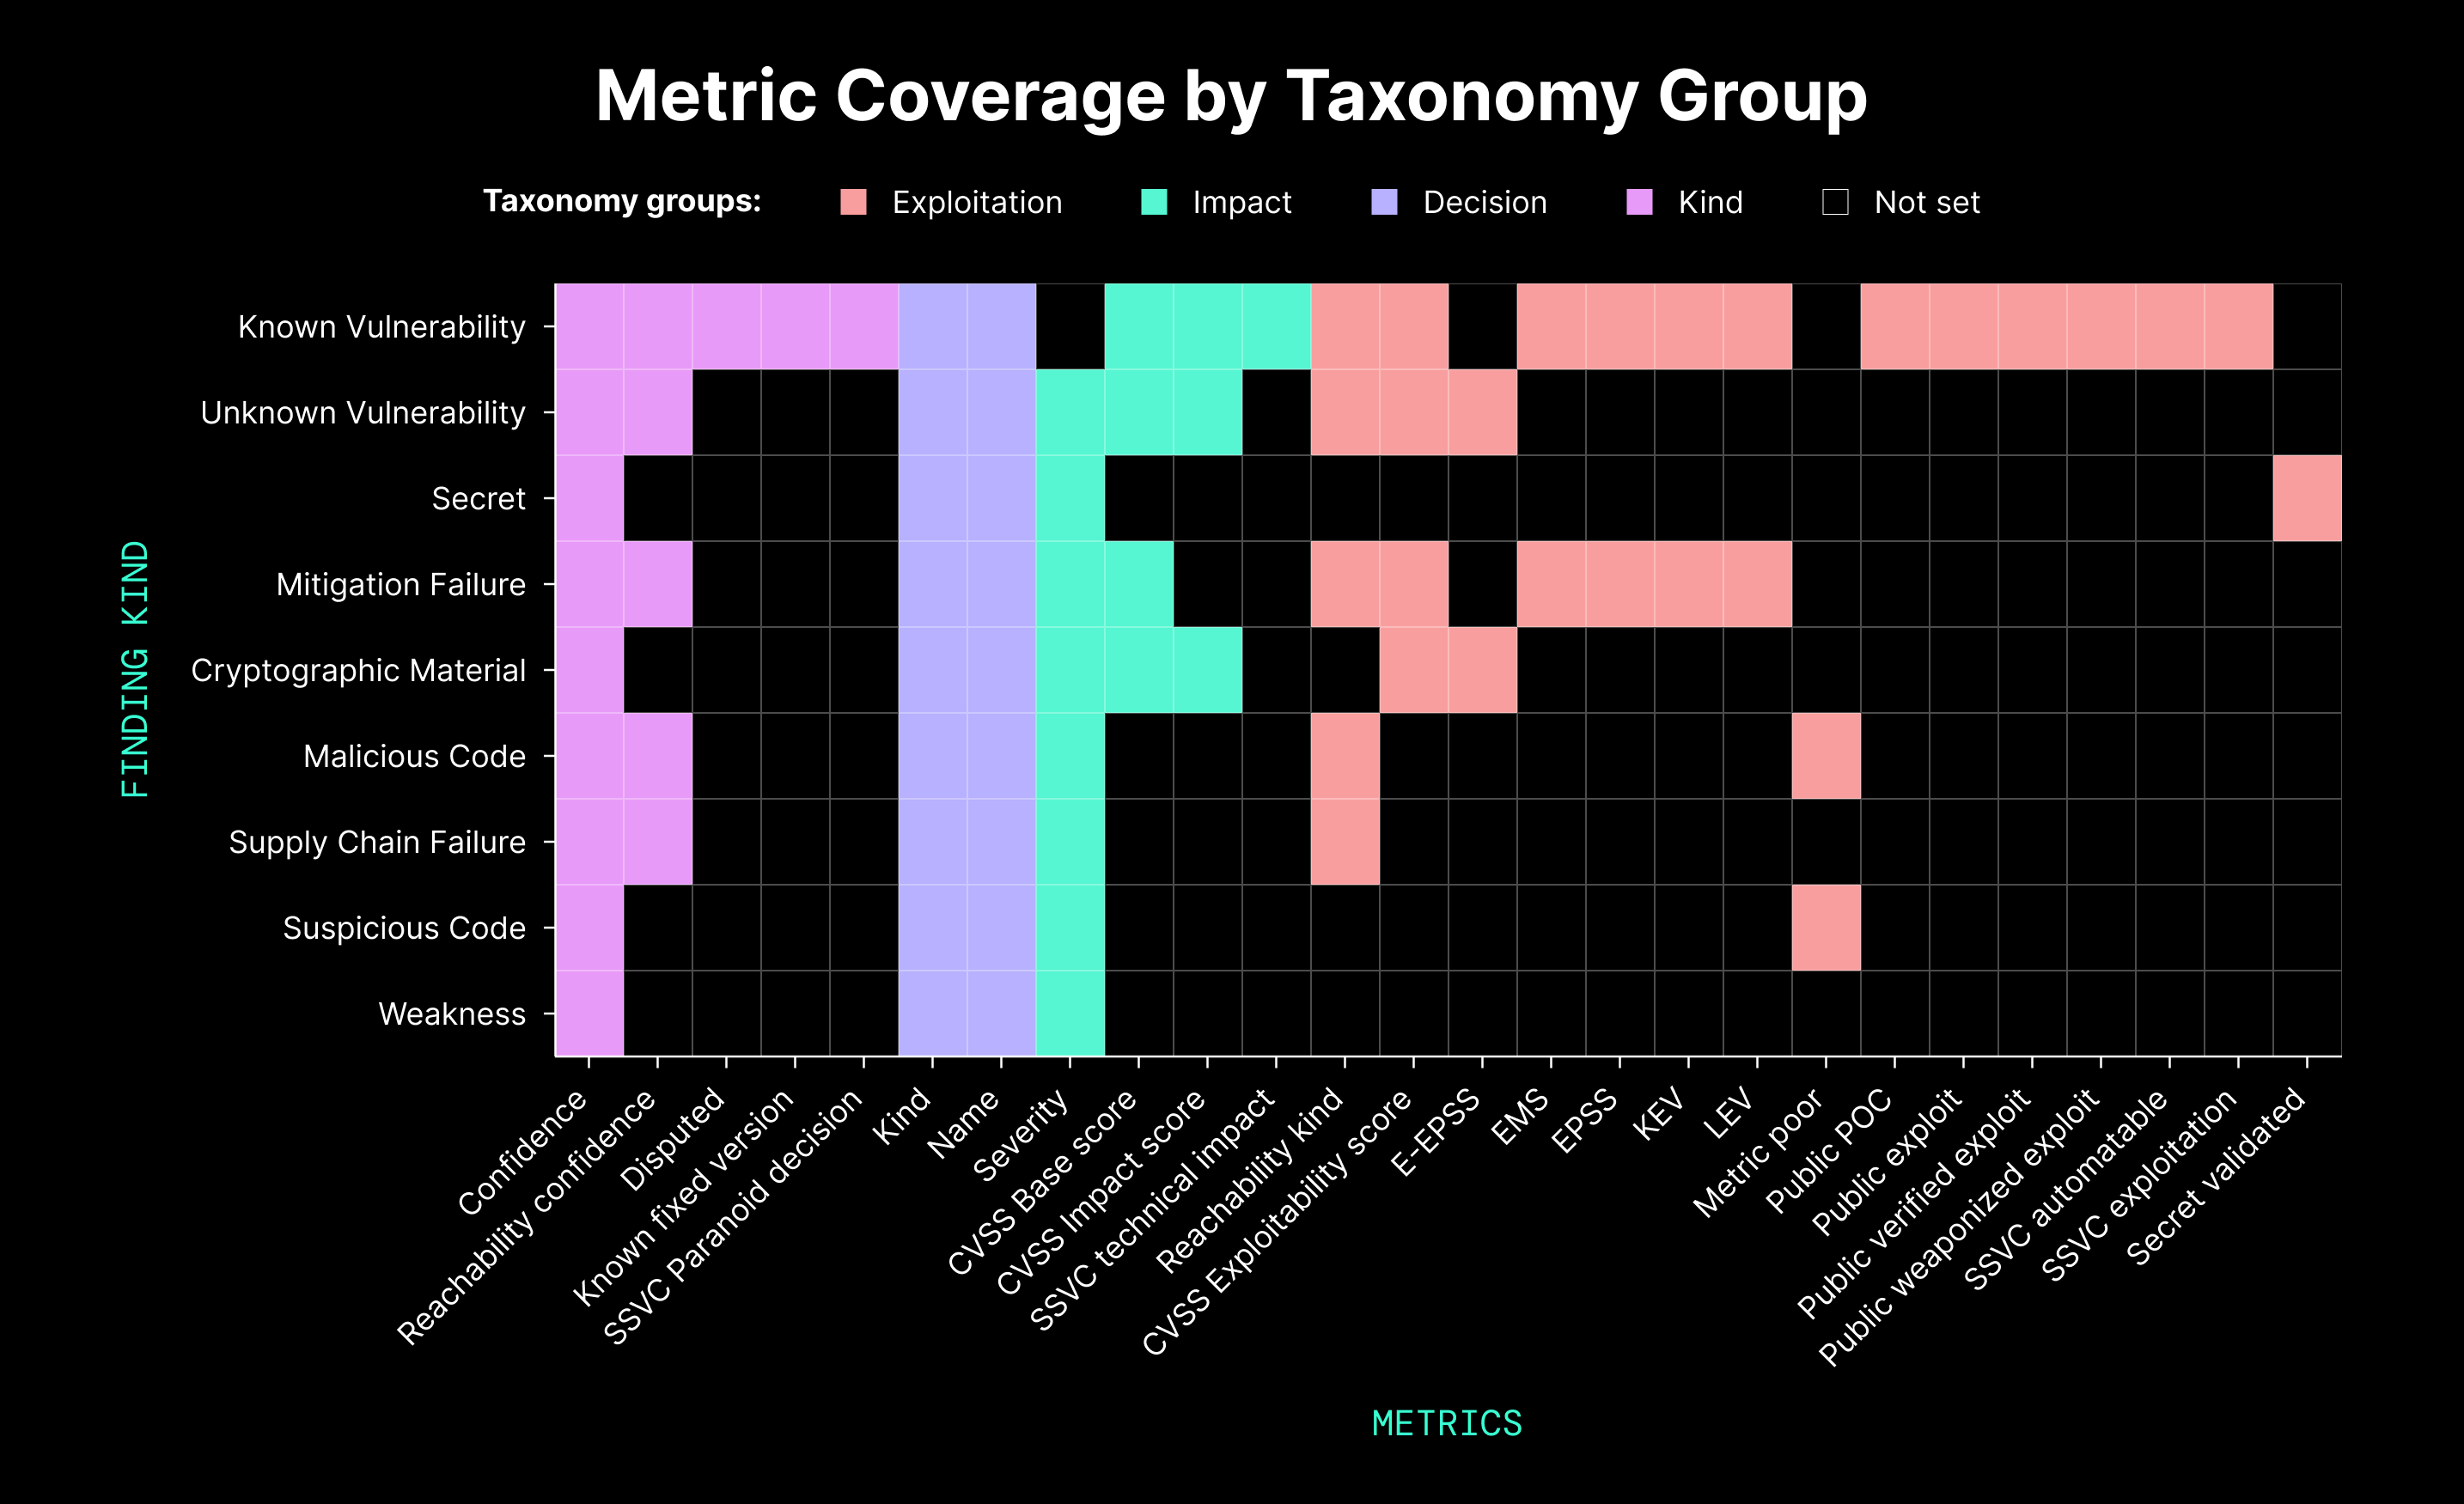
Metric coverage by taxonomy group and finding type. The diagram labels the Name group Kind.
All finding types also carry the Name multiplier. A metric appearing here does not mean it is set for every finding: it means at least one shipped profile assigns it a weight. Metrics with no data for a given finding are handled by weight redistribution.
Examples
The same findings reorder under each profile without rescanning. In the platform you switch profiles from the Risk Score selector in the findings grid. The diagrams below show the weight configuration behind each shipped profile.Balanced
Equal emphasis across all four groups. This produces a general-purpose ranking that no single factor dominates, which suits baseline reviews.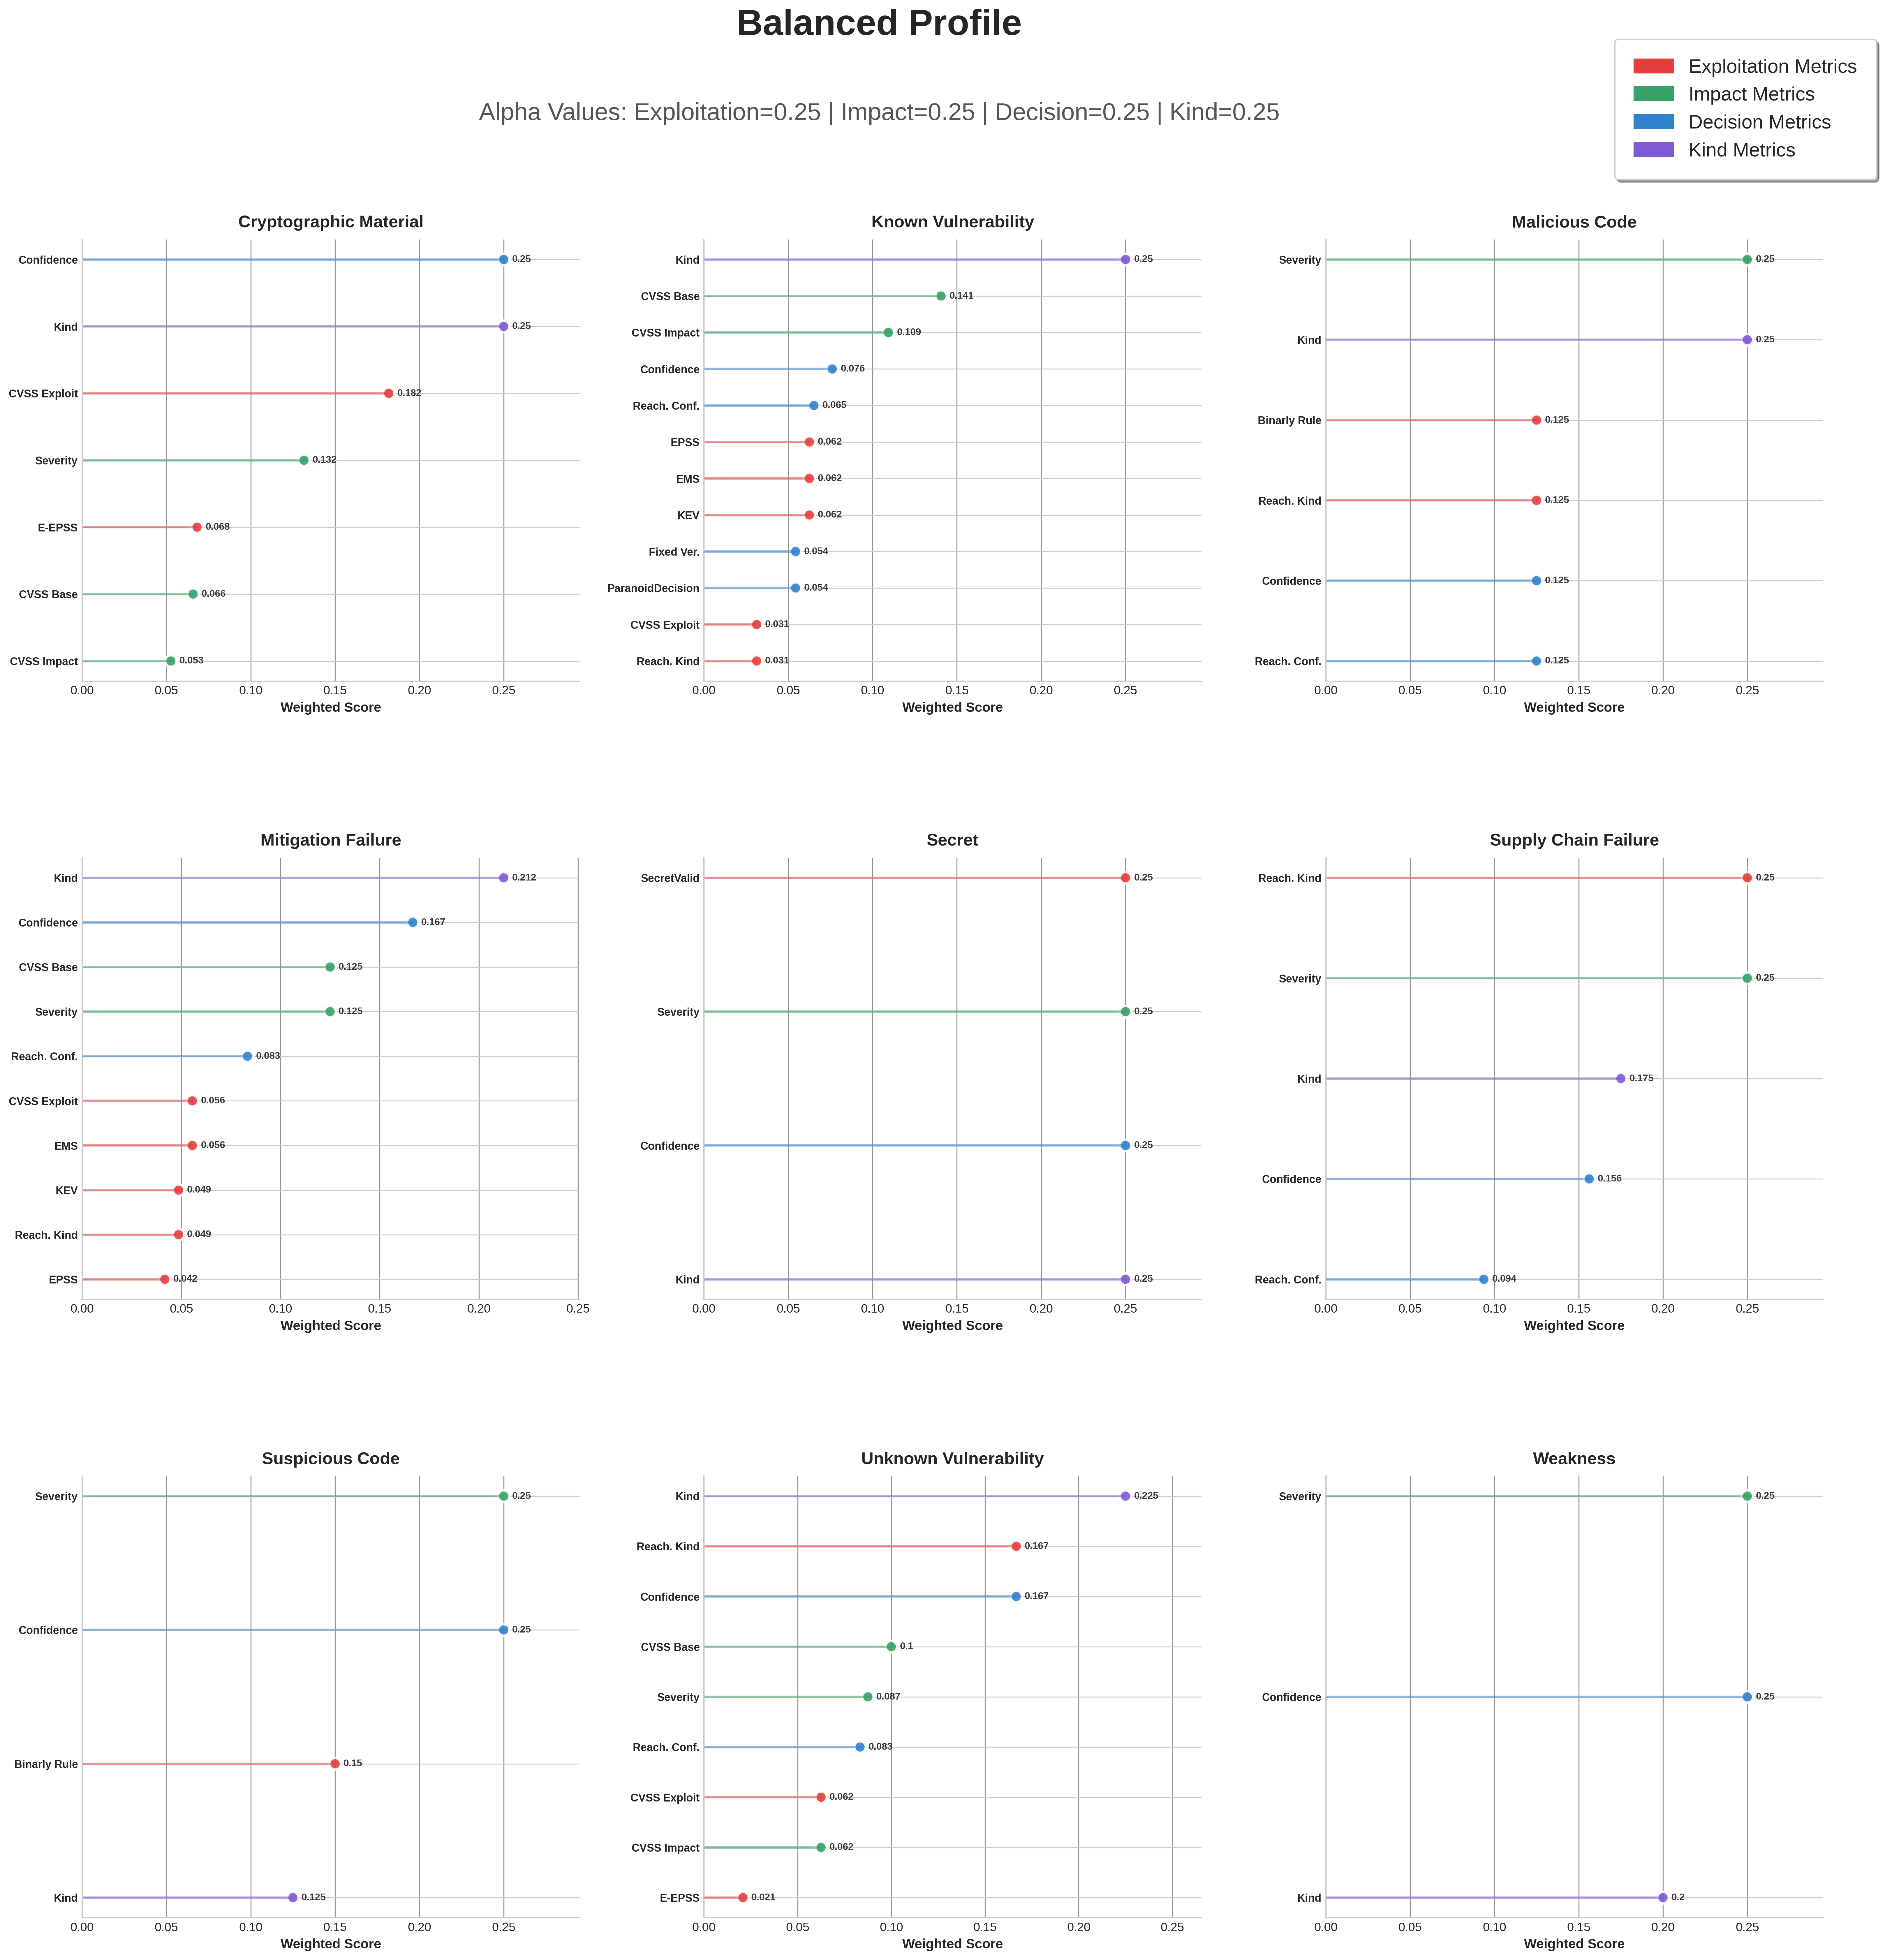
Balanced profile weights.
Exploitation (Exploitability)
The Exploitation group carries 55 percent of the score. Findings with high EPSS and EMS, a KEV listing, or a known public exploit rise to the top, which suits incident response and threat hunting.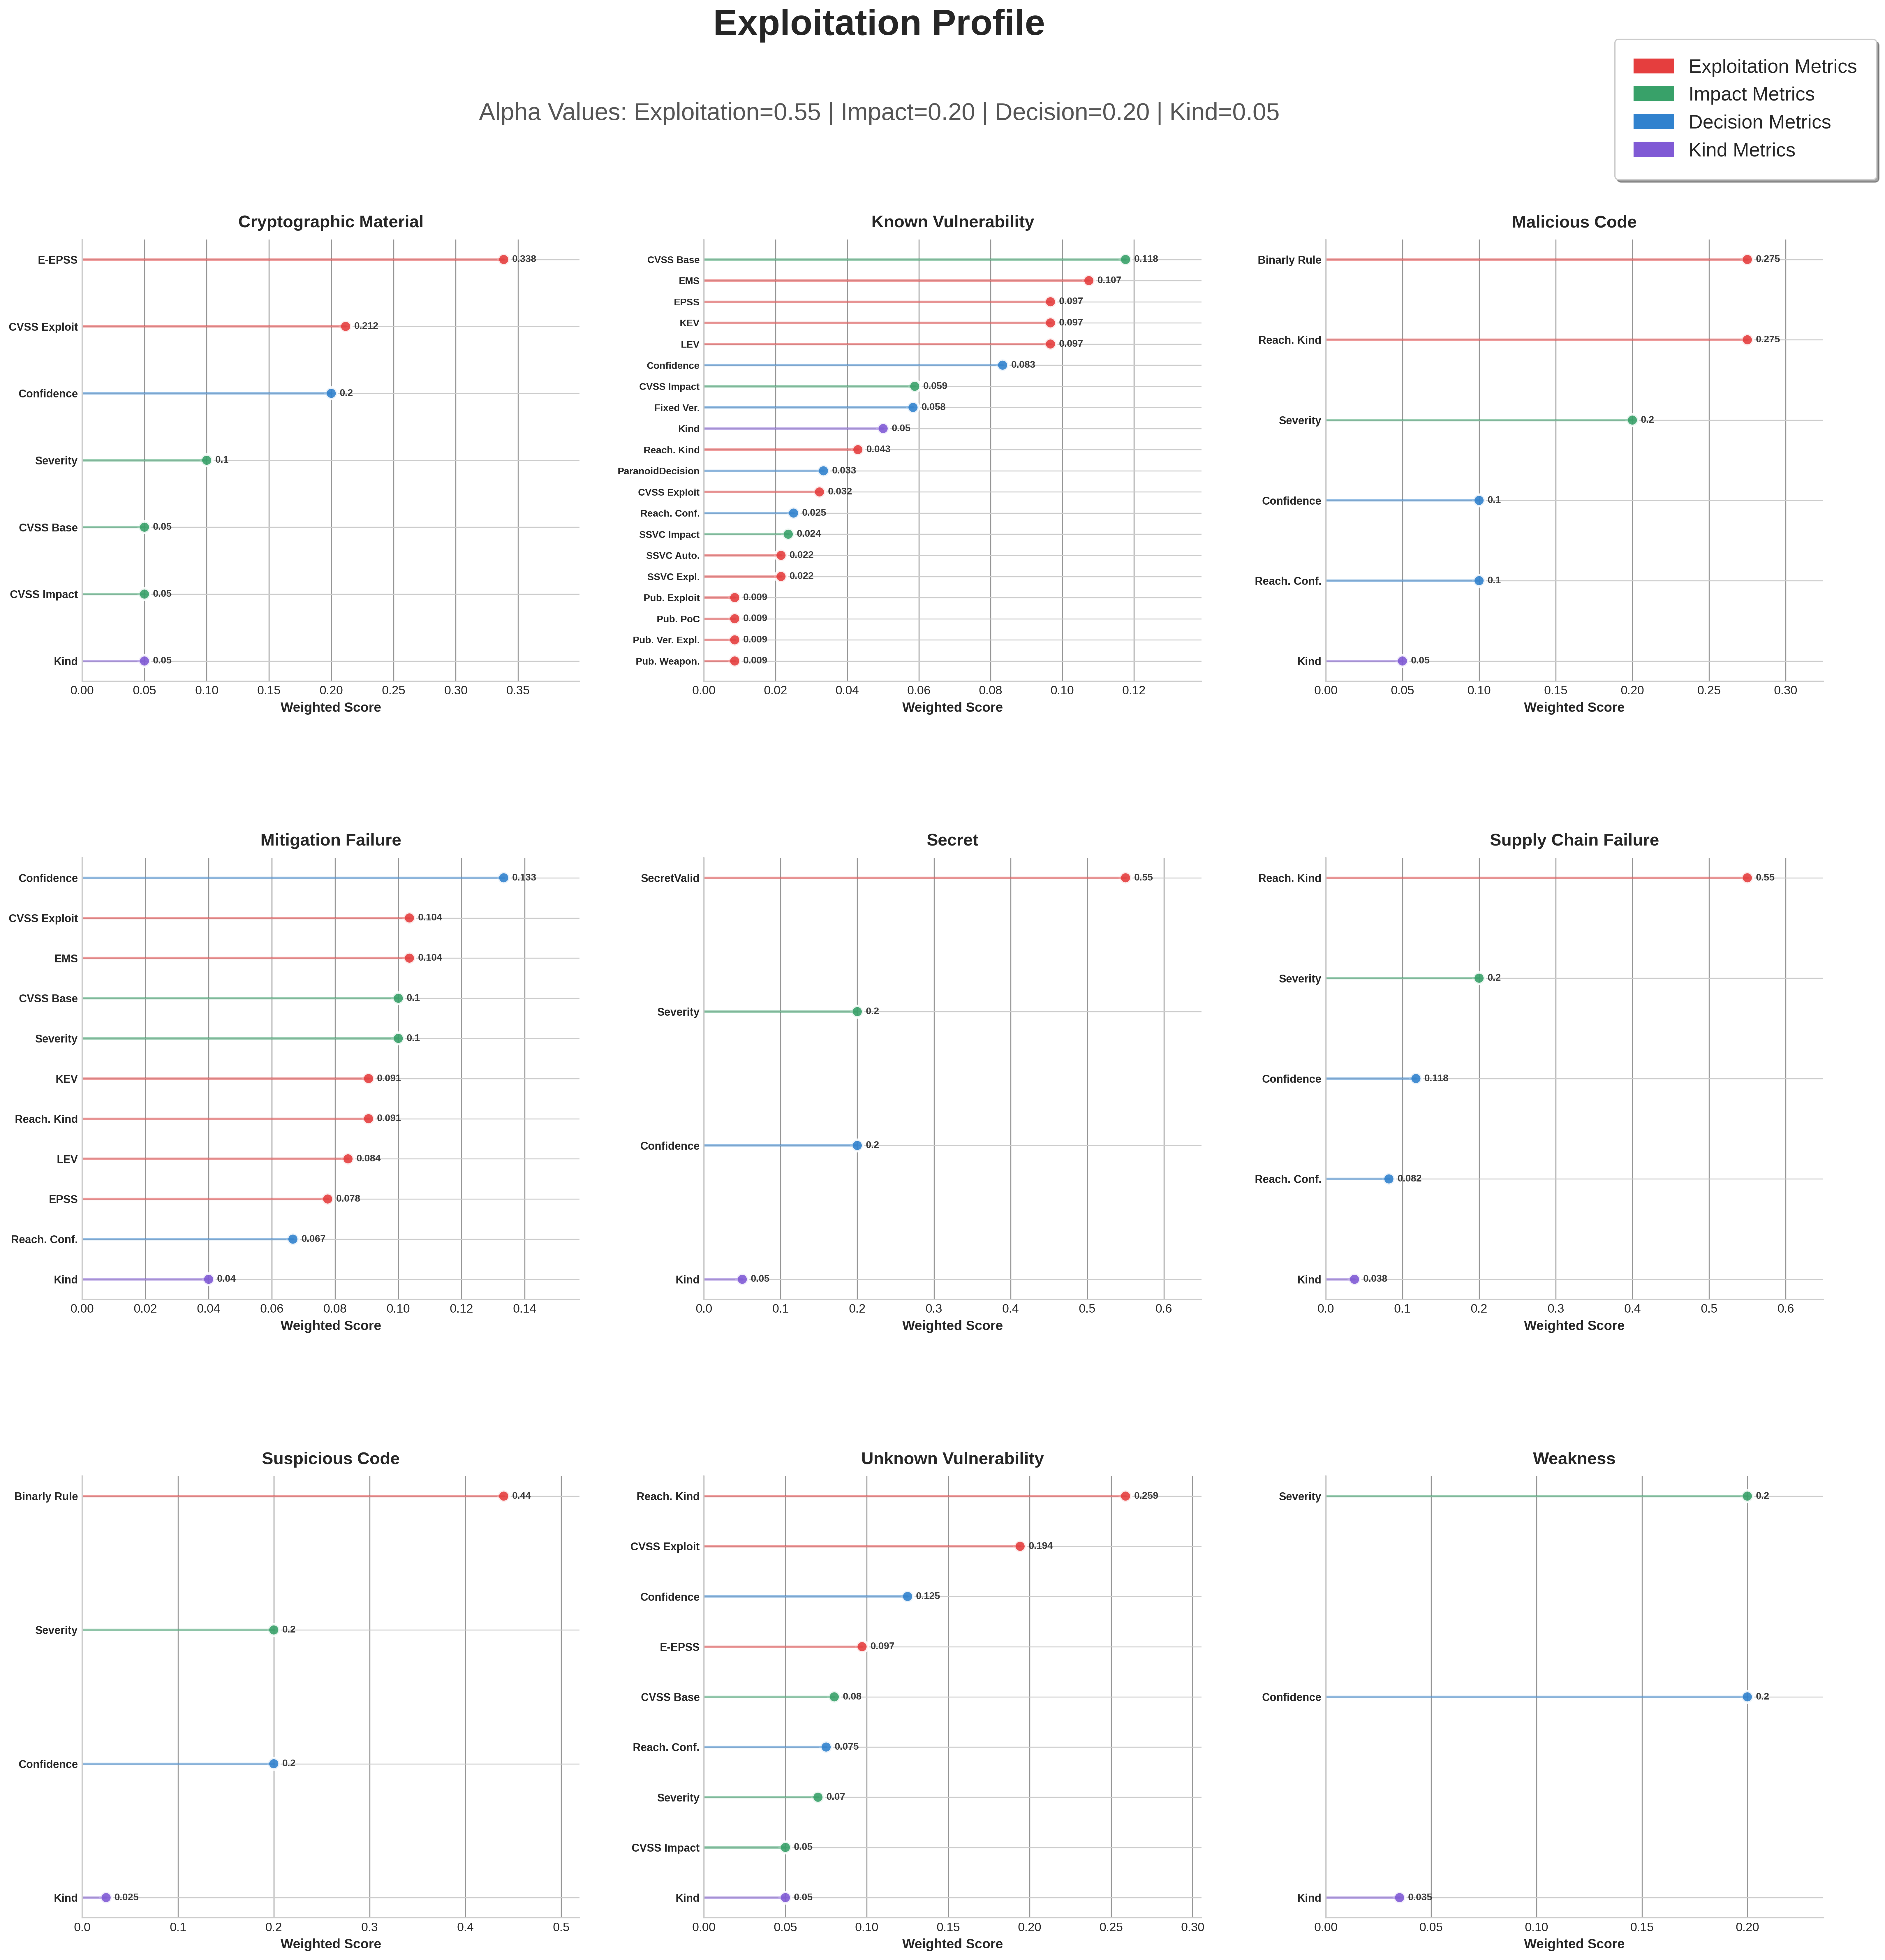
Exploitation (Exploitability) profile weights.
Decision Impact (Actionable Risk)
The Decision and Impact groups together carry 75 percent of the score. Findings with high detection confidence, available reachability data, and high impact rise to the top, which suits vulnerability management and remediation planning.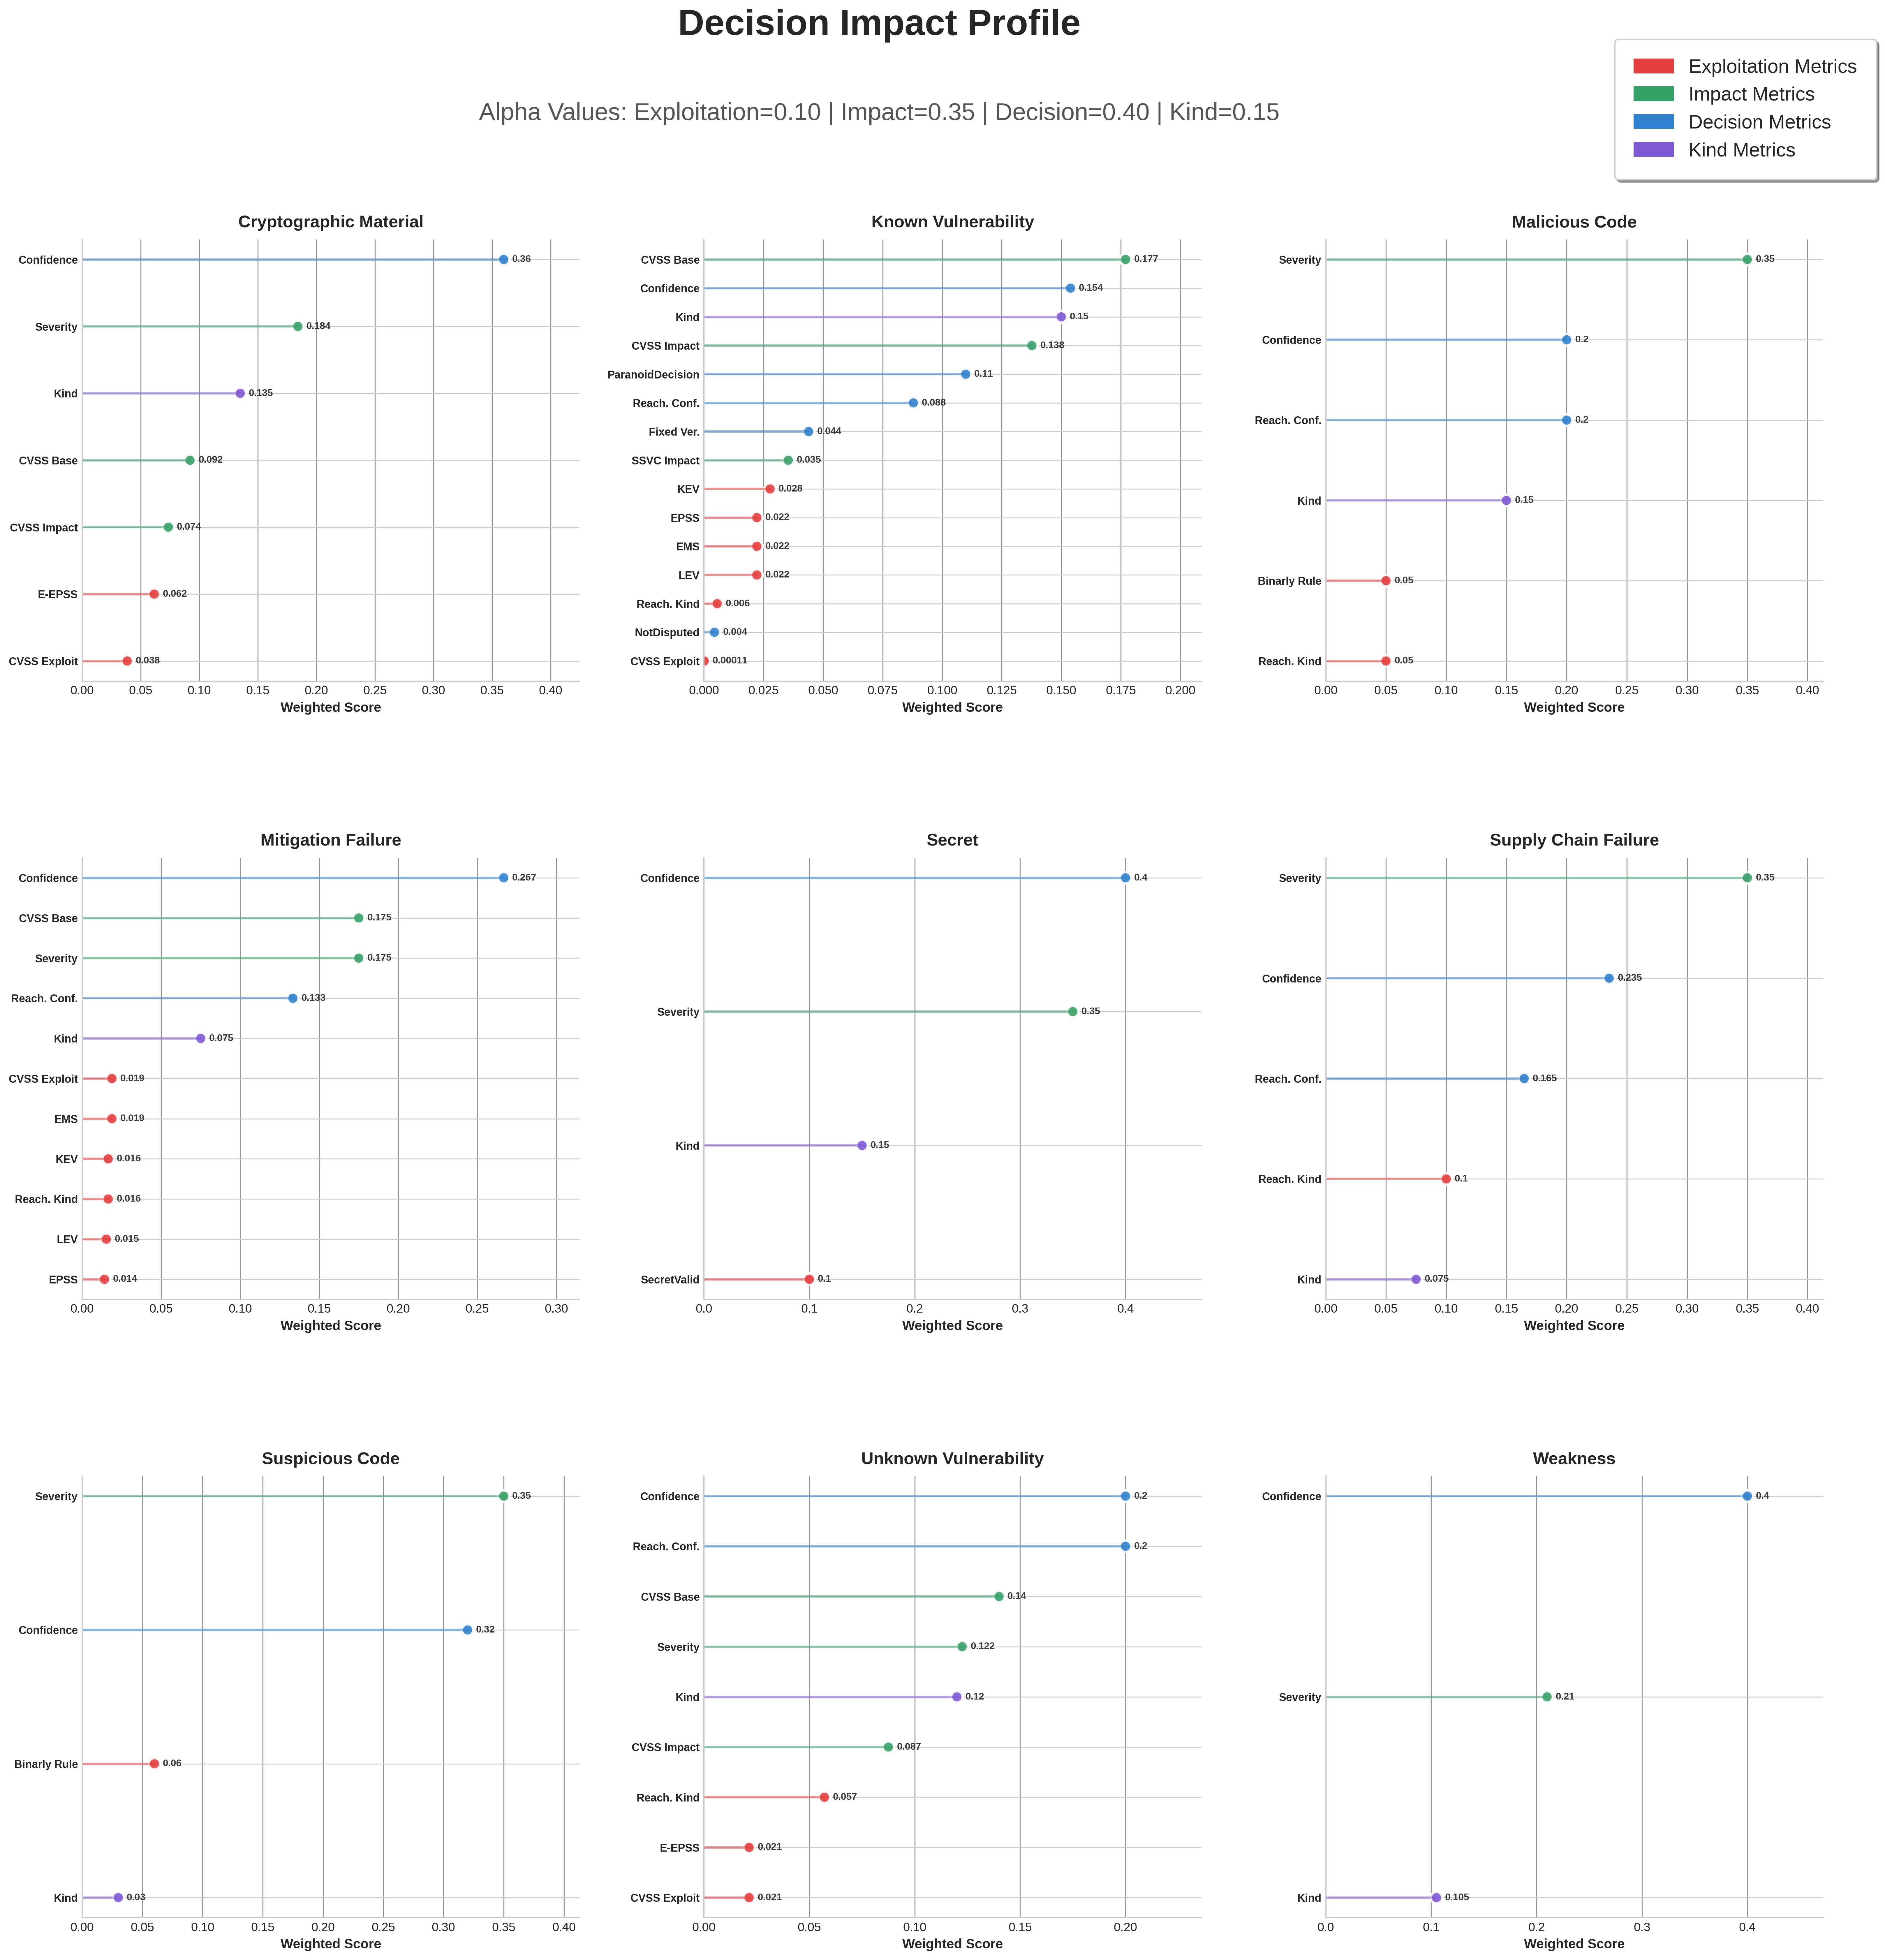
Decision Impact (Actionable Risk) profile weights.
Appendix
Enumeration values
String metrics map to fixed numeric values before scoring.Finding name multipliers
The Name group value for each finding-name prefix. Unlisted names fall back to their closest parent prefix.Redistribution factors
The recoverability factor for each metric, by finding category. Higher values donate more of a missing metric’s weight to its surviving neighbors.Related
Prioritizing with the Risk Score
Pick a profile and sort and filter findings by risk score in the findings grid.
Reachability analysis
How reachability feeds the exploitation and decision groups.
Exploitation Maturity Score
The evidence-based exploitation signal in the score.
Accuracy and confidence
How detection confidence, a decision-group input, is set.