

Why one score
Different scoring systems disagree about what matters. A vulnerability that CVSS ranks near the bottom can be the one with an active public exploit; a high CVSS can sit in code that never runs. The heatmap below ranks the same six vulnerabilities under CVSS, EPSS, and the three Binarly Risk Score profiles: the order changes with each system.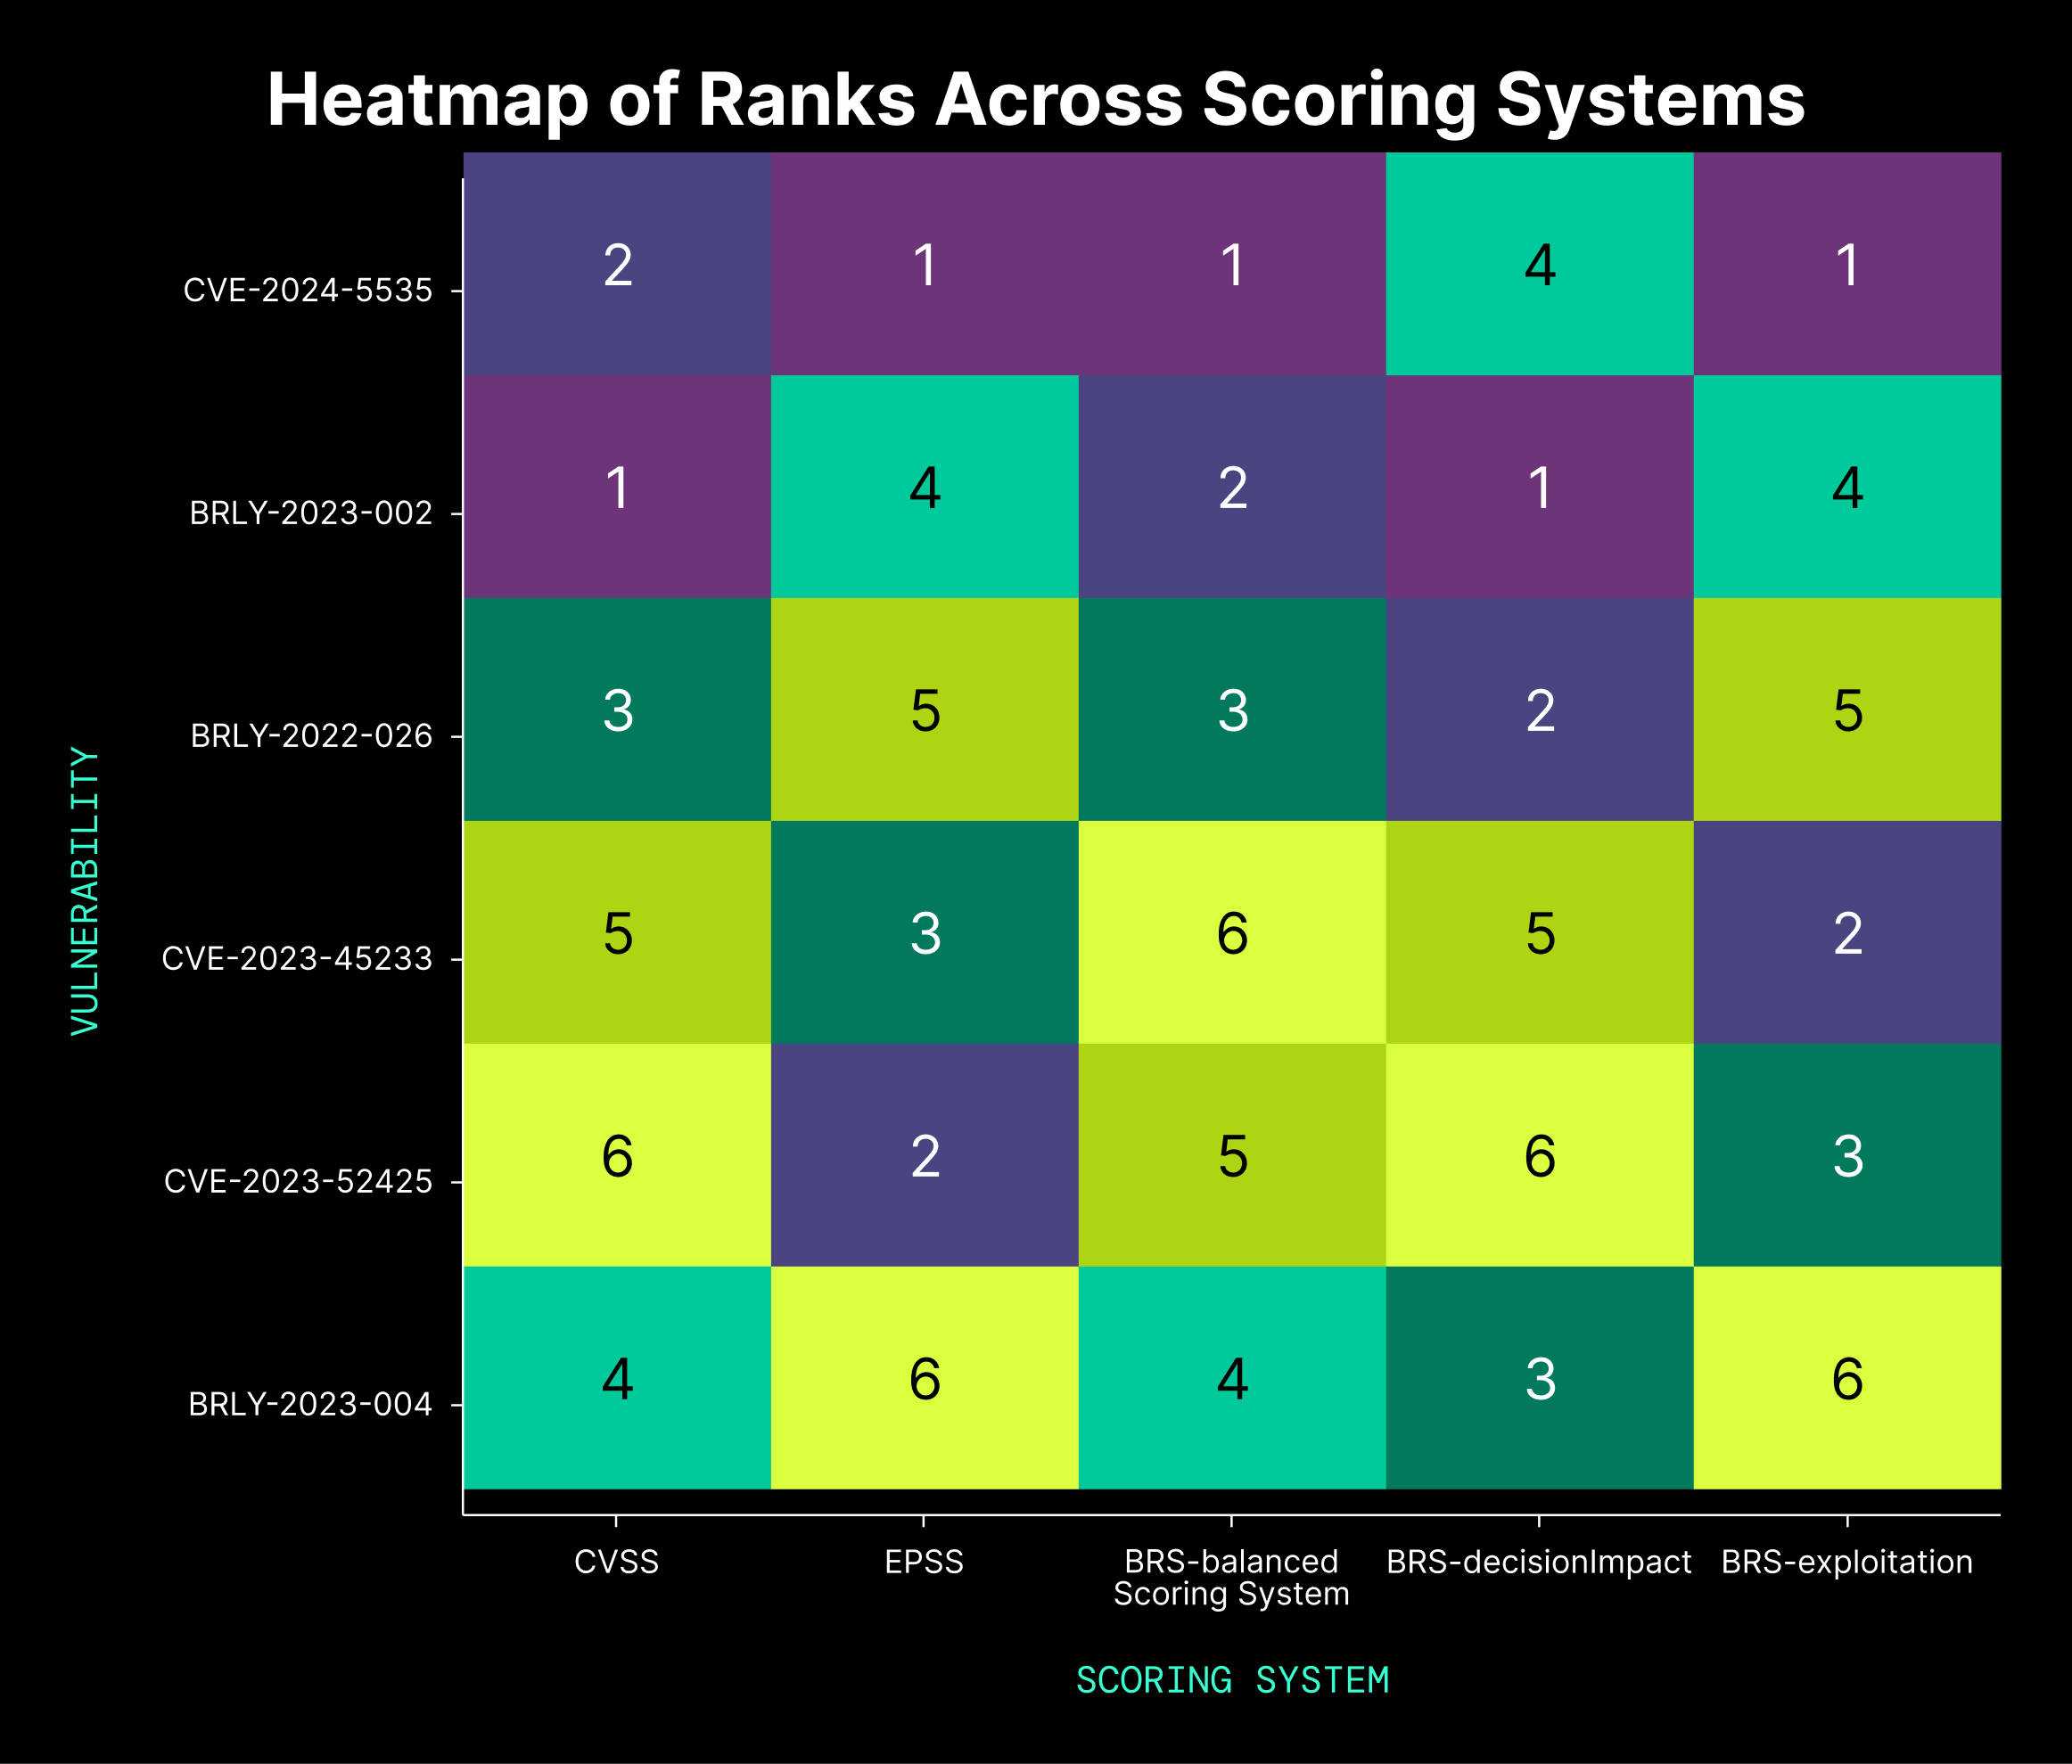
The same vulnerabilities rank differently under CVSS, EPSS, and the Binarly Risk Score profiles.
Choose a profile
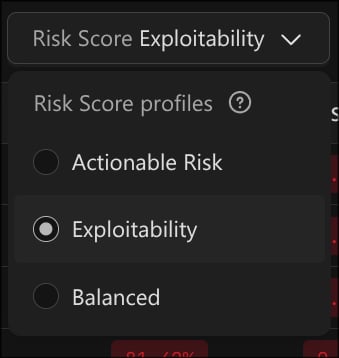
A profile decides how much weight each group of signals carries. The platform ships three, and Decision Impact (Actionable Risk) is the default. Pick the one that matches what you are doing:
The profiles were renamed for clarity: Exploitation is now Exploitability, and Decision Impact is now Actionable Risk. The findings grid shows the current names. For the four signal groups and how each profile weights them, see Binarly Risk Score.
Switching profiles reorders the findings you already scanned. It does not change any underlying data or trigger a rescan, so you can move between profiles freely as your task changes.
Read the score
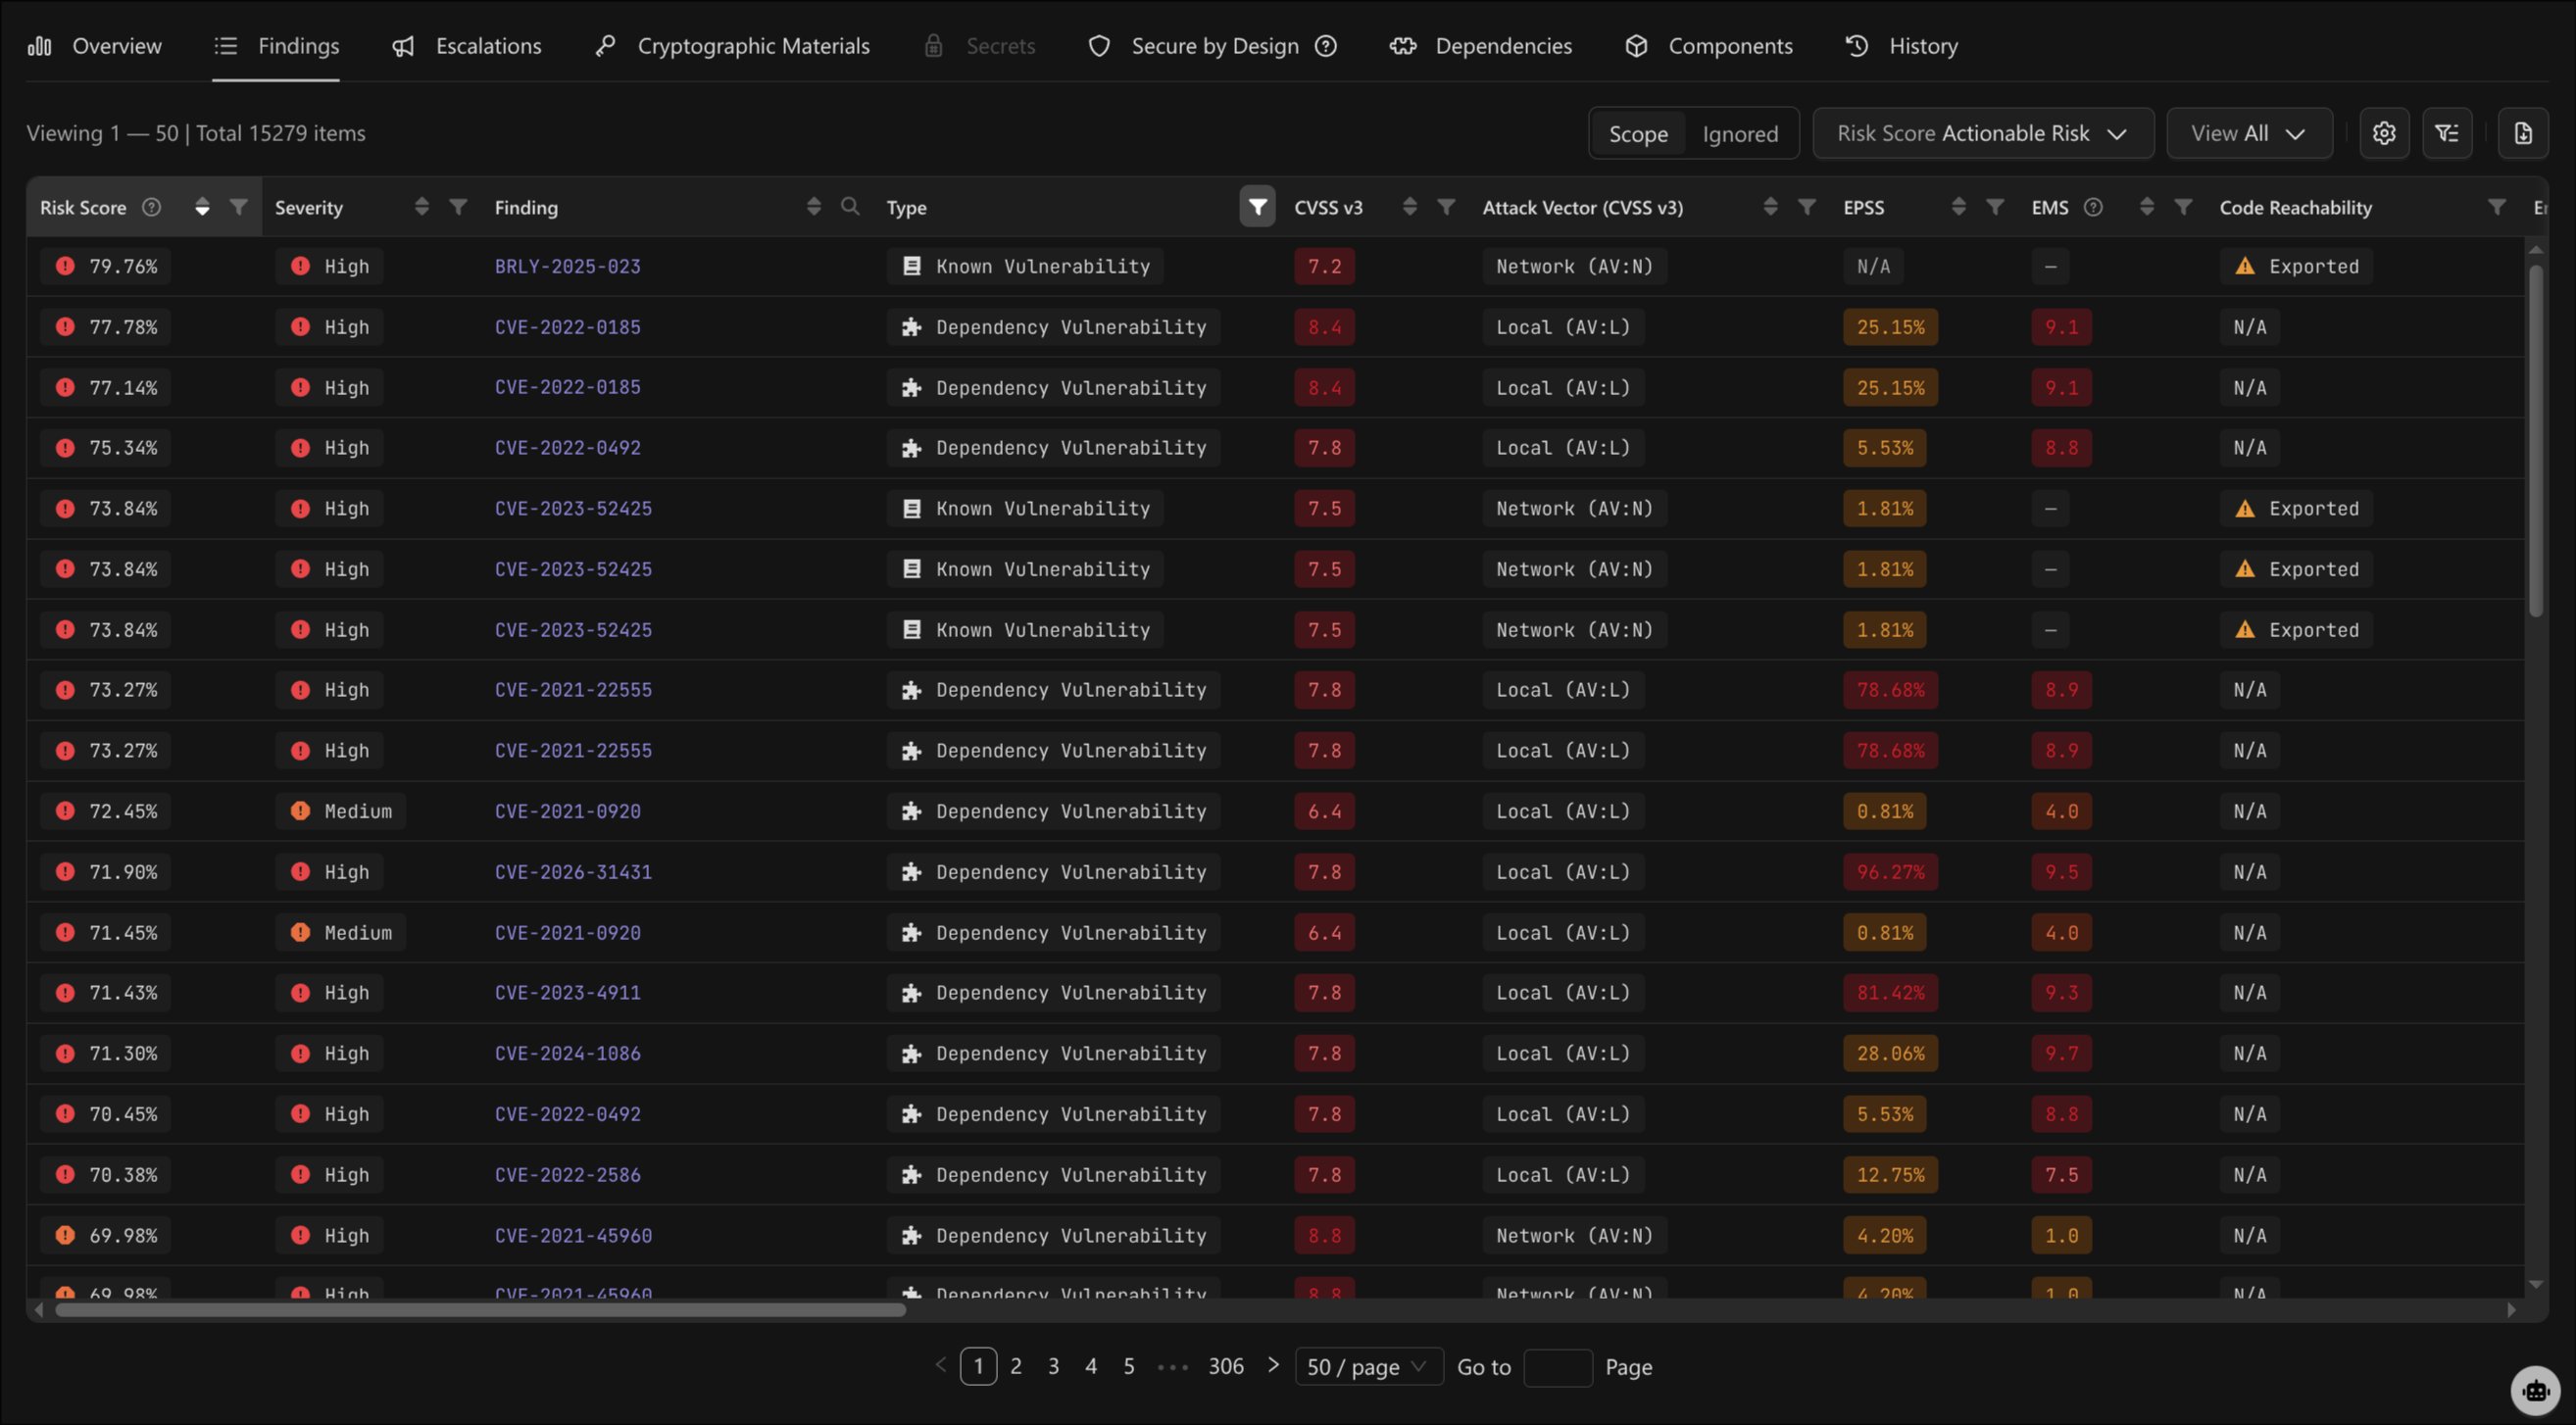
Each finding shows a risk score presented as a percentile. A higher percentile means more signals point to reachable, exploitable risk, so the finding deserves attention sooner. There are no fixed severity bands: you compare and sort on the score itself rather than mapping it to a label.Prioritize findings
The risk score is integrated in the findings grids: the global findings grid, the image findings grid, and finding sub-grids such as crypto findings. Each grid adds a Risk Score column and the profile selector above it. In the global and image findings grids, risk score is the default ordering metric, so findings open sorted by risk score, highest first, on the default Decision Impact (Actionable Risk) profile. Work the findings by risk:1
Select a profile
Choose Balanced, Exploitability, or Actionable Risk from the Risk Score selector above the grid. The grid re-ranks in place.
2
Sort by risk score
The global and image findings grids are sorted by the Risk Score column by default, highest first. Re-sort or reverse the order from the column header if you need a different view.
3
Filter by score
Filter by risk score to focus on the top of the range while you remediate.
Related
- Binarly Risk Score - the taxonomy groups, formula, profiles, and full metric reference.
- Binarly Reachability Analysis - how reachability feeds the score.
- EMS Escalations - the Exploitation Maturity Score.
- Accuracy and confidence - how detection confidence is set.