Uploading and Organizing Images
- Image Upload:
- Images can be added to a product either during its creation or later via the Upload Image option.
- Products are designed to track images by version. Proper trending and analysis comparisons by version are dependent on this structure. Although products c_an_ accommodate an unlimited number of different images, for optimal operation of the Product you MUST:
- Group similar images or related versions within the same product.
- Separate dissimilar images into distinct products for better organization and analysis clarity.
- Recommendations for Organization:
- Use consistent naming conventions for products and associated images to maintain a logical structure.
- Ensure that each product contains only related images to simplify analysis and reporting.
Viewing Images in a Product
- Accessing Images:
- Navigate to the desired product to view its uploaded images.
- The list of images associated with the product will display in the grid view.
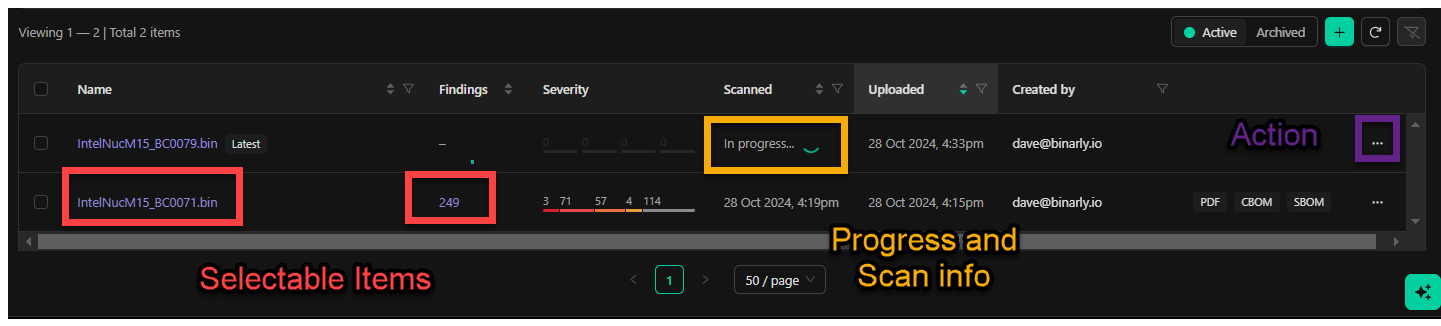
- Processing Status:
- After an image is uploaded or submitted via the API, it will initially show a “Processing” status while the platform analyzes the binary.
- Once the analysis is complete:
- The file name will be displayed in purple text.
- The number of findings associated with the image will also appear in the grid.
- Detailed Findings:
- Click on the file name (purple text) to view a comprehensive list of findings for the analyzed binary.
- This detailed view provides insight into vulnerabilities, misconfigurations, and other issues identified during the analysis.
Benefits of Viewing Images by Product
- Provides a consolidated view of all analyzed binaries within a logical grouping.
- Enables efficient navigation between images and their findings for detailed review and remediation planning.
- Facilitates tracking and management of multiple versions or updates of the same firmware or software.
Trending
Trending provides a graphical representation of issues identified over time for a selected product. This visualization helps users track the evolution of vulnerabilities, misconfigurations, or other findings, offering a clear visual summary of changes based on new scans.Key Features of the Trending Graph
- Issues Over Time:
- Displays trends in findings categorized by age and severity.
- Highlights the progression of issues, including new discoveries and resolved items.
- Customizable Date Ranges:
- Users can adjust the date range to focus on specific timeframes of interest.
- This flexibility allows for targeted insights into historical patterns or recent developments.
- Visual Summaries:
- Offers an at-a-glance overview of the product’s security posture and its changes over time.
- Identifies spikes or reductions in findings, aiding in prioritization and decision-making.
Benefits of the Trending Feature
- Actionable Insights:
- Helps prioritize remediation efforts by highlighting trends in critical or high-severity findings.
- Historical Context:
- Provides a historical perspective on the product’s security, enabling better understanding of long-term risks.
- Customization:
- Allows users to tailor the view to meet specific needs, whether for reporting, analysis, or planning.
Latest Scan
The Latest Scan feature tags the most recent analysis of a product as “Latest” and ensures its results are prominently reported in both the primary and product-specific dashboards. This feature provides a comparative view, allowing users to monitor changes and assess progress across different versions of the same binaries.Key Features of the Latest Scan
- Comparative Analysis:
- Visibility into differences between versions of the same binaries, showing improvements, new findings, or regressions.
- Provides insights into how updates or patches have impacted the security posture.
- Dashboards Visibility :
- Results from the latest scan are displayed on:
- The primary dashboard, offering a high-level overview of all products.
- The product-specific dashboard, focusing on granular details for that product.
- Results from the latest scan are displayed on:
- Third-Party Supply Chain Validation:
- Confirms that updated binaries address previously identified issues.
- Offers visibility into potential new issues or regressions introduced in the latest version.
- OEMs and Software Vendor Use Cases:
- Demonstrates improvements in code quality and security measures addressing vulnerabilities.
- Validates that updates meet the security and compliance requirements of end-users or partners.
Benefits of the Latest Scan
- Improved Monitoring:
- Enables continuous tracking of a product’s security posture over successive scans.
- Actionable Insights:
- Helps OEMs, software vendors, and supply chain partners prioritize further remediation or development efforts.
Upload Image (Plus Icon)
With a product selected, images can be uploaded by clicking the plus icon in the lower right section of the grid view. This action automatically associates the uploaded image with the selected product. Once the upload dialog appears, you can drag and drop the file or navigate to it on your machine.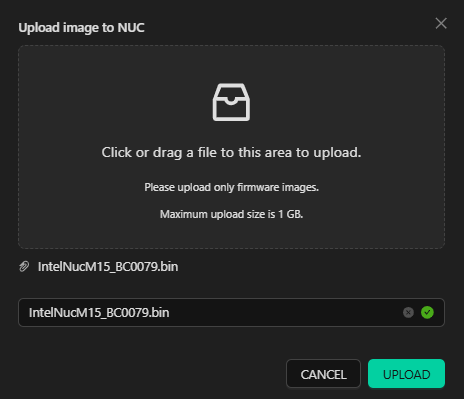
Fields
Fields in the Images Grid
The Images Grid provides detailed data about analyzed images, organized into columns. Each column heading offers options to sort and filter, enabling efficient navigation—particularly useful for tracking multiple image versions within a product.Key Fields
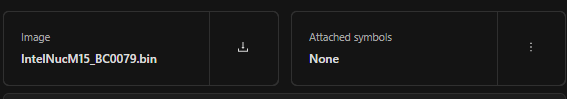
- Name:
- Displays the file name of the uploaded image.
- After analysis completion, the name becomes clickable, providing access to a detailed overview of the results.
- Findings:
- Shows the total number of findings identified in the analyzed image.
- Excludes mitigations and weaknesses to focus on actionable issues.
- Severity:
- Categorizes findings by severity level:
- Critical, High, Medium, Low, and Unspecified.
- Provides counts for each category, helping users prioritize issues.
- Categorizes findings by severity level:
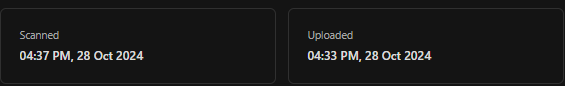
- Scanned and Uploaded:
- Displays two timestamps:
- Uploaded: When the image was submitted.
- Scanned: When the analysis was completed.
- Displays two timestamps:
- Created By:
- Identifies the user who uploaded the image and initiated its scan, offering accountability.
- Feature Tags:
- Highlights the features available for the image, such as:
- Reports: JSON and PDF analysis summaries.
- SBOM: Software Bill of Materials.
- CBOM: Cryptographic Bill of Materials.
- Highlights the features available for the image, such as:
- Action Menu:
- Provides follow-up options for the analyzed image, including:
- Rescan the image.
- Adding Debug Information/Symbols.
- Generating Reports (e.g., PDF, JSON).
- Downloading the image file, SBOM, or CBOM.
- Archiving the image for better workspace organization.
- Provides follow-up options for the analyzed image, including:
- Efficient Navigation: Sorting and filtering options simplify image tracking and review.
- Detailed Insights: Provides quick access to findings and severity breakdowns for informed decision-making.
- Streamlined Workflow: The action menu enhances usability, enabling fast execution of key tasks like rescanning or generating reports.
Viewing image details
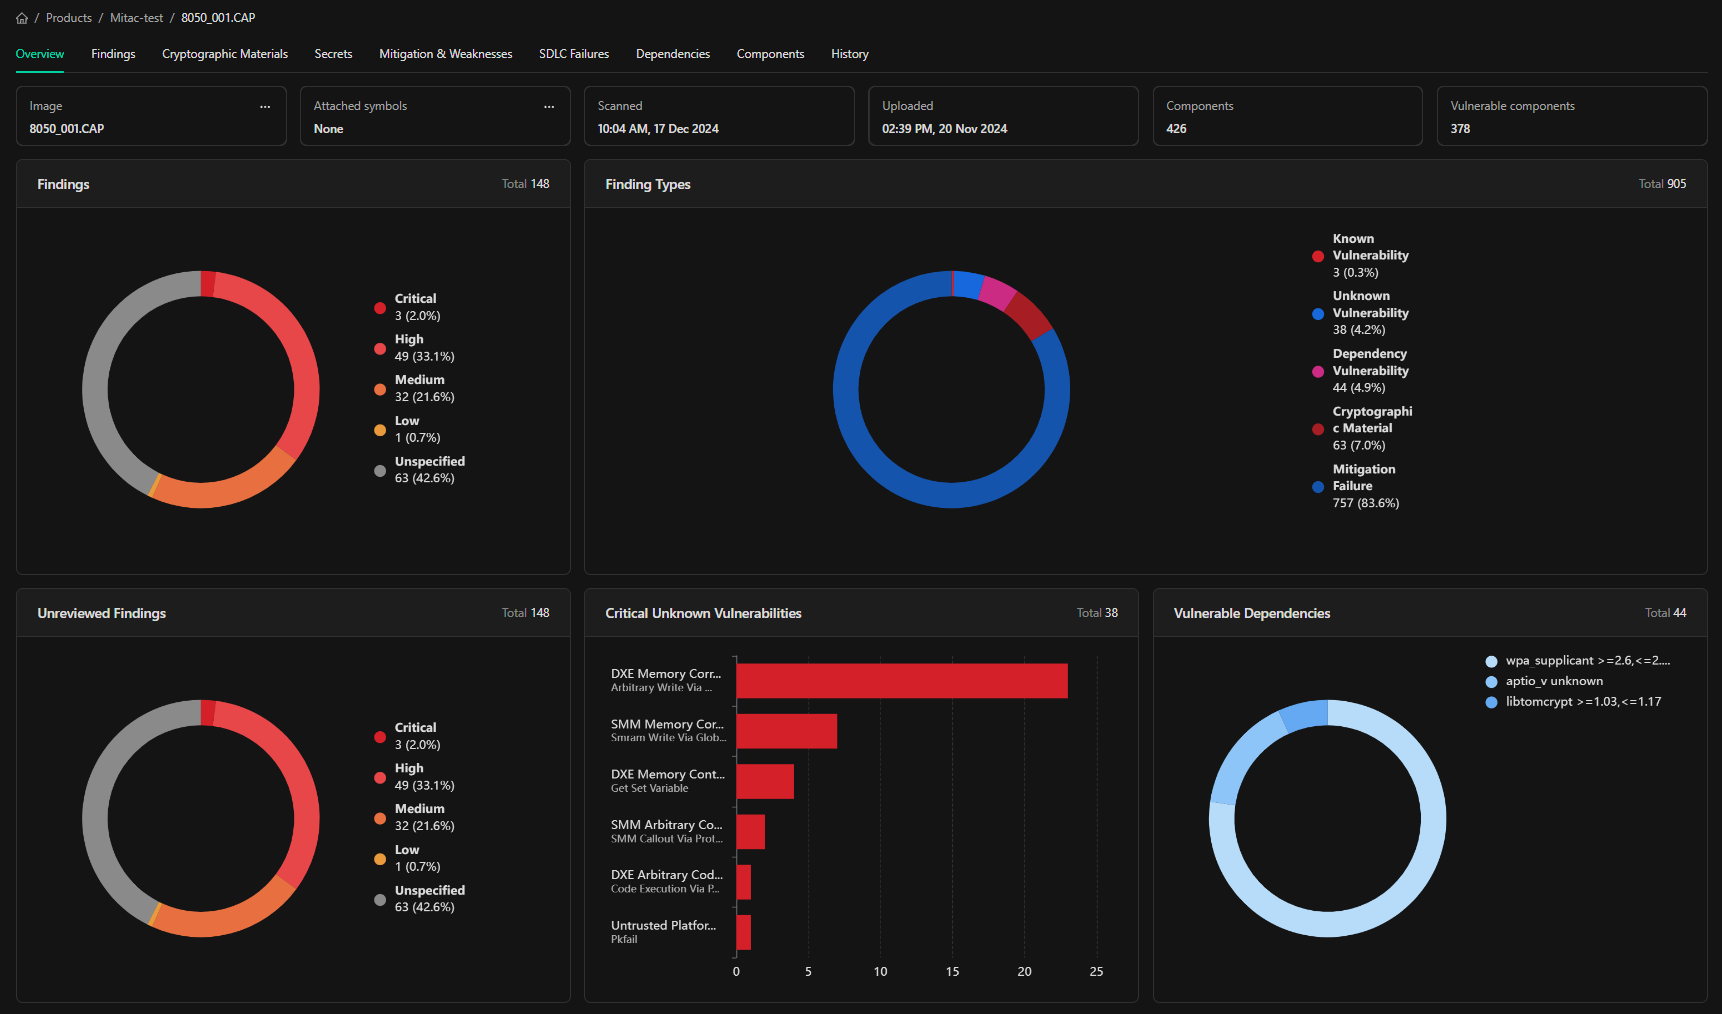
Products are created to organize and house images assessed by the platform. Images can be uploaded directly to the platform from the actions menus discussed above or from an API call run from a command line, CI pipeline, or other automated mechanism. Please see the API documentation and use cases guide for information about leveraging the API. Once an image is selected from the product View, it will present all information about the findings discovered during the scan of the selected image. This image-specific view serves as a primary interface to view the details of the various finding types, assess and prioritize actions to be taken, and better understand the overall risk associated with a specific image scan.Image Overview (Product Specific Dashboard)
The image overview serves as a heads-up display and summary review of the findings discovered within the analyzed image. Tabbed navigation to the different finding types and categories, as well as interactive graphical displays of the findings, are available to help aid understanding of the analysis and Provide easy navigation to specific areas of Interest or most critical findings.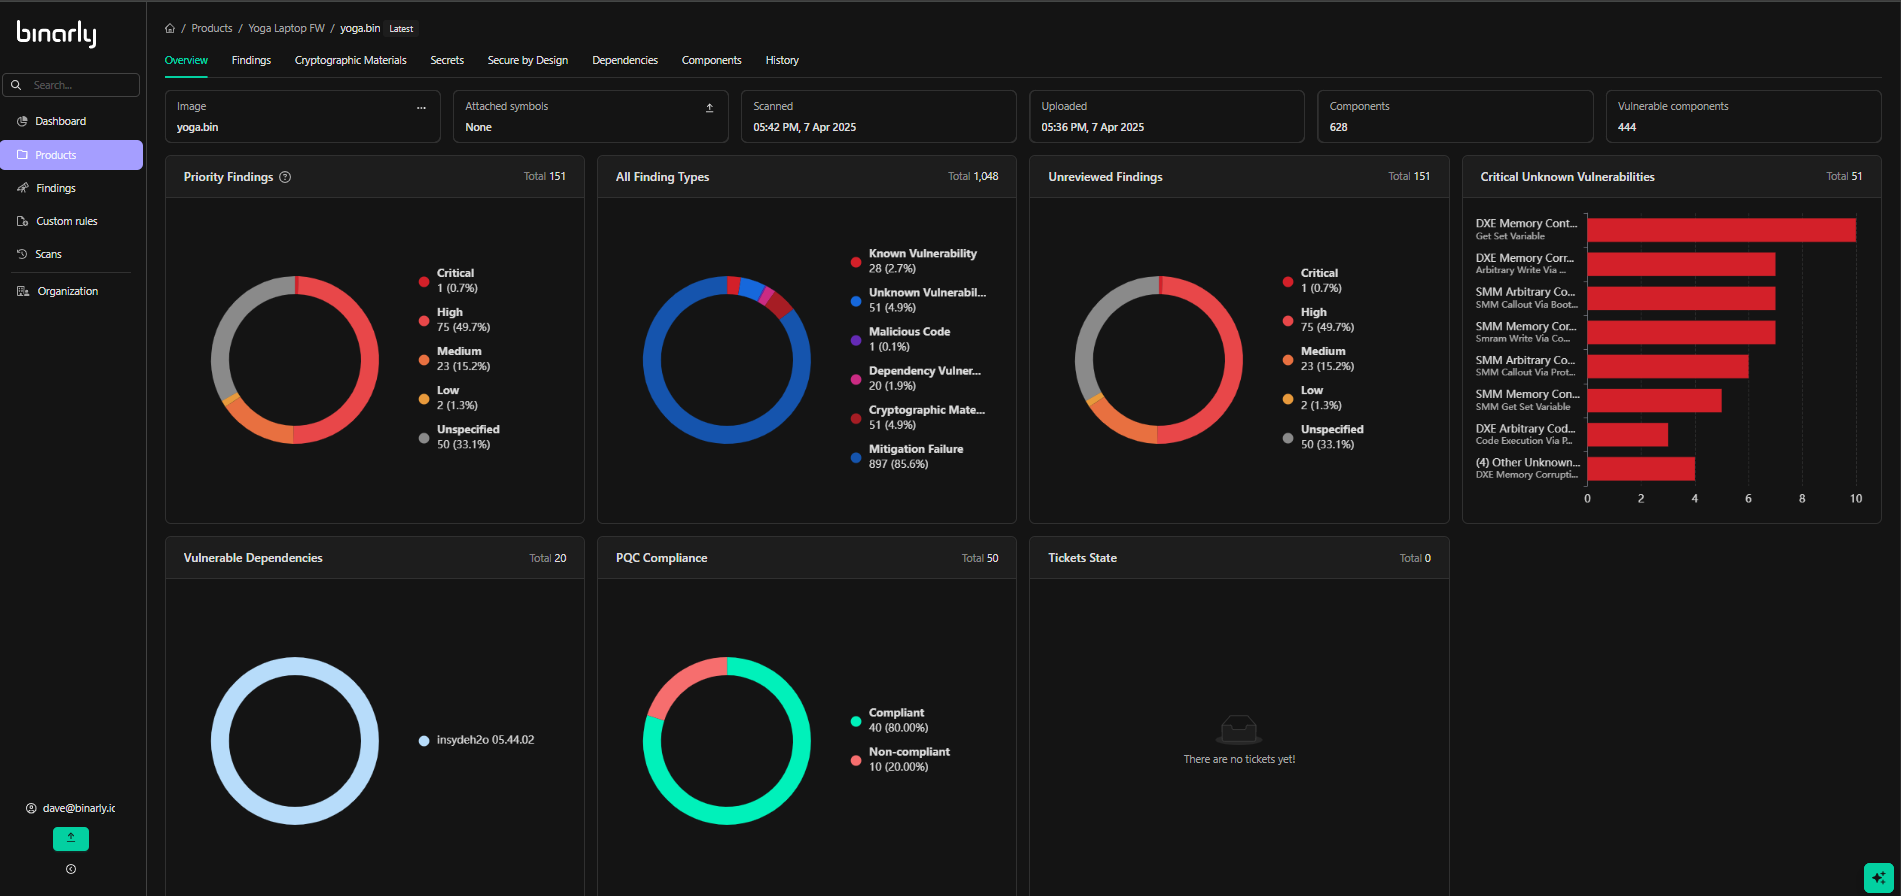
Interactive dashboard graphs ( Product specific)
- The CVSS column includes a range-based filter to specify a range of scores.
- The Type column provides a pick-list menu with available options.
- The Finding column includes a free-form search box for text-based searches.
 *Filter by Finding
*
*Filter by Finding
*
Filter Settings
You can configure column display settings through the Settings menu, accessible via the gear icon on the upper right of the grid. Selecting this icon opens the Column Selection menu, where you can customize the grid view to suit your preferences. Here, you can choose which columns to display in the grid view. To fix a column to the left or right side of the grid, use the up and down arrows beside each column name. Additionally, you can reorder columns by dragging and dropping them to your preferred sequence. This allows you to effectively organize and prioritize the data view, optimizing your workflow’s layout.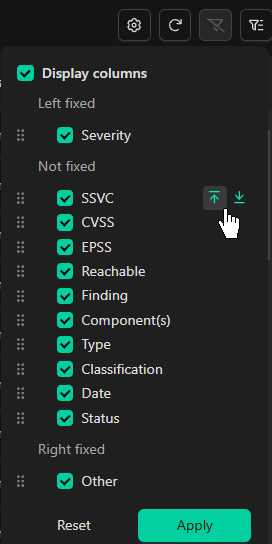
Filters Menu (Advanced Filtering)
As the platform processes an increasing volume of images and products, the associated datasets and findings can become extensive. To manage this complexity, creating customized datasets based on specific criteria is essential for efficiently searching and visualizing issues.Overview of the Filters Menu
The Filters Menu, located in the upper-right corner of the interface, offers powerful tools for constructing complex filters. These filters enable users to apply a wide range of criteria across all data columns, allowing for the creation of tailored views that focus on specific findings or groups of findings.Key Capabilities
- Custom Filtering: Apply filters to refine datasets based on severity, product type, date, vulnerability class, or other parameters.
- Multi-Criteria Filtering: Combine multiple filters to create highly specific datasets, enhancing the ability to identify and prioritize critical issues.
- Column-Specific Filters: Use column-level filtering to target findings relevant to your analysis.
Benefits
- Efficient Data Management: Navigate and manage large datasets with ease, ensuring that key findings are not overlooked.
- Focused Insights: Narrow down results to the most relevant issues, allowing for targeted remediation efforts.
- Streamlined Exploration: Create customized views that simplify the analysis process and improve decision-making efficiency.
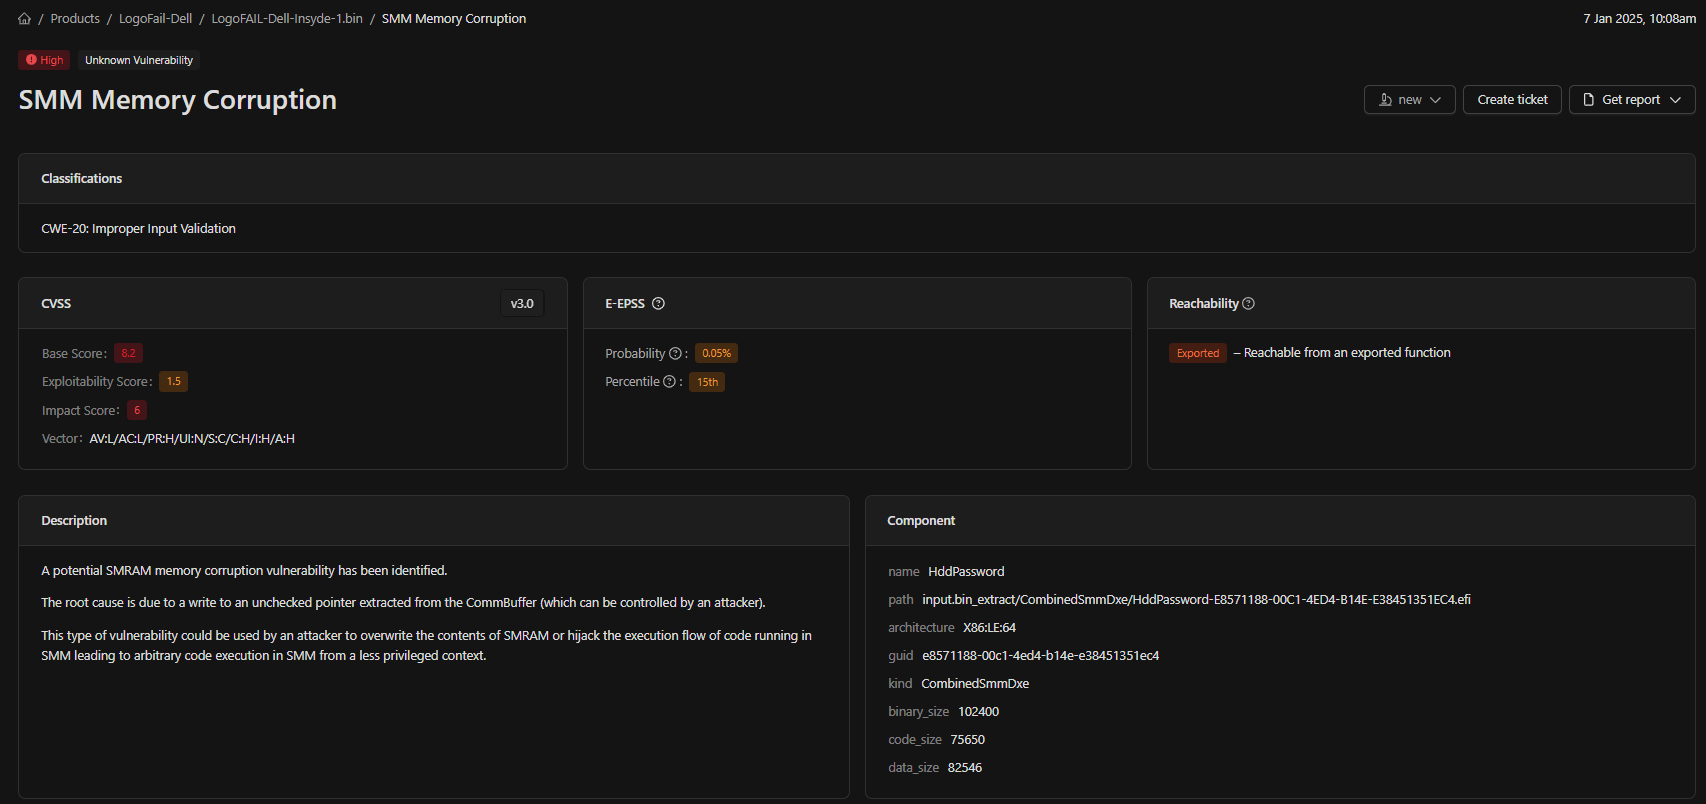
Finding Details
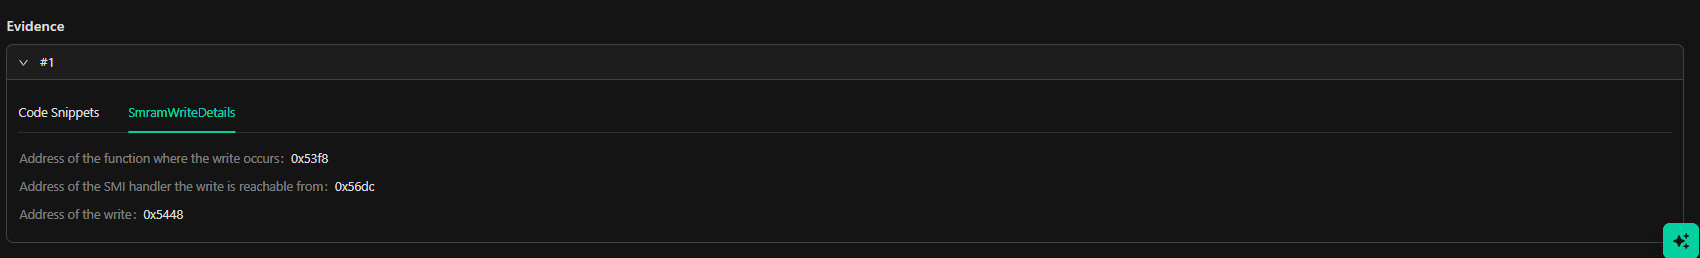
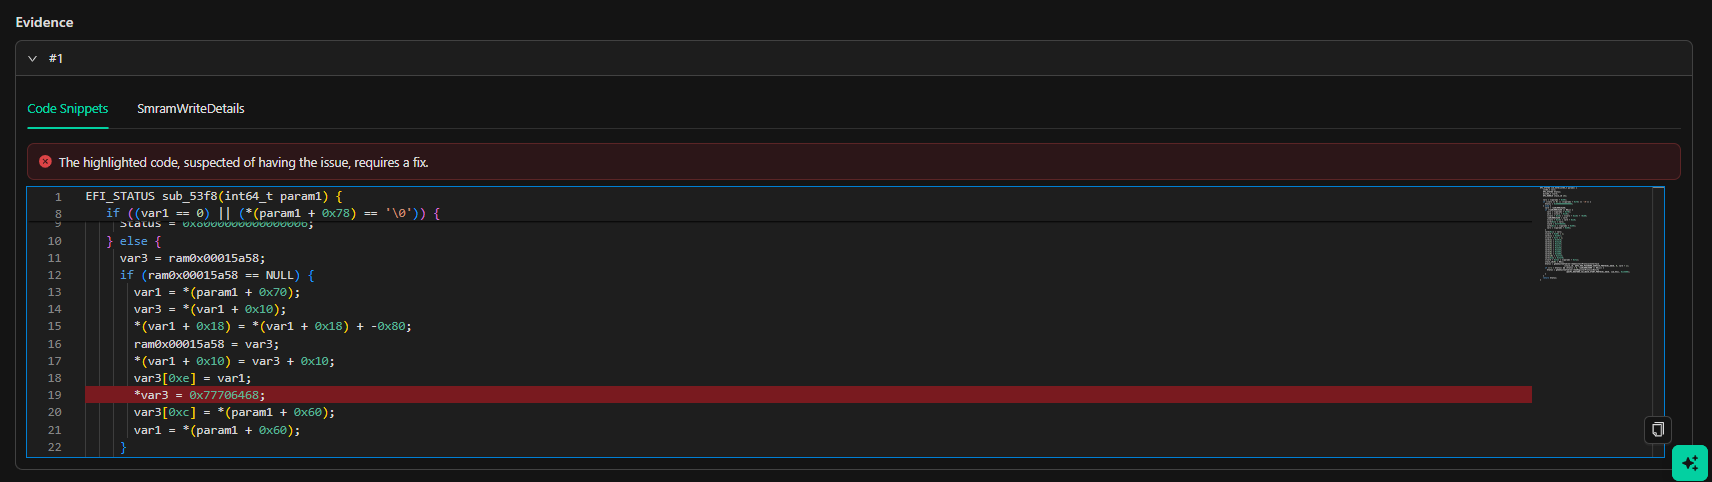
To access detailed information about a specific finding, click on any linked text or anywhere within the corresponding row in the Findings Grid. This action will open the detailed view for the selected finding, where the type of finding and available data determine the information displayed. The finding details page displays reference information such as metrics from the Common Vulnerability Scoring System (CVSS), the Exploit Prediction Scoring System (EPSS), and the Exploit Maturity Score (EMS). It also shows confidence and reachability analysis to indicate the exploitability of the finding. Classifications are provided using the Common Weakness Enumeration (CWE), Mitre Adversarial Tactics, Techniques, and Common Knowledge (ATT&CK), and the Malware Behavior Catalog (MBC) ontologies. The page indicates whether the vulnerability is listed in CISA’s Known Exploited Vulnerabilities Catalog (KEV) and whether it is known to be used in ransomware campaigns. Additionally, the page lists vulnerability identifiers issued by the Common Vulnerabilities and Exposures (CVE) system, along with a description of the vulnerability, its impact, recommended actions, and links to proof-of-concept code, weaponized exploits, vendor announcements, and other references. The page also provides a detailed breakdown of the component affected by the finding. Components may be files, UEFI modules, or PEI modules detected in the uploaded image. In addition to the component’s name and path inside the image, the finding details page shows its size, type, and type-specific information, such as an executable’s dynamic linker or a UEFI module’s GUID. If the component is a binary, information about the type of compilers used during the build process appears next to it. Multiple compilers or multiple versions of the same compiler may have contributed to the build, and the build environment section also includes the instruction set architecture and the operating system ecosystem of each compiler. The finding details include the evidence, which delivers deep technical insights. Depending on the type of finding, this may be decompiled pseudocode, affected address ranges, or a structured representation of the offending artifact, such as a cryptographic asset’s key length, algorithm, and certificate validity. If the affected component is part of a dependency, its product name, vendor, and detected version range are shown on the finding details page. If the issue indicated by the finding can be remediated by updating the dependency, the earliest safe version is also displayed alongside the dependency information. The detailed view enables users to investigate findings effectively and provides the necessary context to prioritize remediation efforts. This granular insight supports a comprehensive understanding of vulnerabilities,their associated risks and mitigation actions to be considered.Finding Detail Options
Within a findings, options exist to afford users the ability to set a status or mark a specific finding with a label, create tickets using the built-in Integrations, and generate reports specific to that findingSet Status
The Set Status feature allows users to categorize a finding’s progress or resolution state. These statuses are visible to all users and are reflected in the Unreviewed Findings graph on the product-specific dashboard. This functionality aids in tracking review progress and documenting decisions regarding specific findings within an image.Status Options
- New:
- Default status for all findings that have not been reviewed or updated.
- Represents findings that require initial assessment.
- In Progress:
- Indicates a finding is under active review, investigation, or remediation.
- Used when:
- The issue is being addressed in code.
- Mitigation efforts are underway by a third-party vendor.
- Rejected:
- Marks findings that are:
- Determined to be false positives.
- Classified as non-threats (e.g., mitigated upstream or deemed unreachable).
- Commonly used when a finding does not require further action.
- Marks findings that are:
- Remediated:
- Used for findings that have been successfully patched or mitigated.
- Represents a resolved issue with no further action required.
Create Ticket
The Binarly Transparency Platform offers a built-in, Two way integration with Atlassian Jira, enabling seamless issue tracking and management. To use this feature, the Jira integration must be pre-configured via the Main Settings menu.Configuring Jira Integration
For detailed instructions on configuring Jira integration, please refer to the Intergerations Section.Using the “Create Ticket” Feature
Once the integration is set up, the Create Ticket option allows you to generate issues directly within your Jira system, leveraging the two-way integration capability. Key functionality includes:- Issue Creation:
- Findings from the Transparency Platform can be forwarded as Jira issues.
- The integration automatically transfers finding details into the newly created Jira ticket.
- Organizational Alignment:
- Tickets are created within your organization’s Jira project structure, ensuring alignment with existing workflows.
- Visibility in the Binarly Transparency Platform:
- After a Jira ticket is created, the corresponding finding in the Transparency Platform will display the Jira ticket headline and a direct link to the Jira issue.
- This integration enables streamlined tracking and resolution without switching between platforms.
Get reports
This option gives you the ability to generate finding specific detailed reports in either a JSON, PDF, or CSV format. these reports will contain all pertinent finding details including All relevant finding information (names, descriptions, and Reachability analysis), References (CVE, EPSS, CVSS, advisories) , and detailed component vulnerability information (Offset or relative address, handler information, pseudo code representation).Generating Detailed Reports The “Get Reports” feature enables users to generate comprehensive, finding-specific reports in JSON or PDF formats. These reports provide a thorough breakdown of all pertinent details related to identified findings, ensuring complete visibility into vulnerabilities and associated risks. Key elements included in the reports are:
- Finding Information:
- Names and descriptions of the findings.
- Reachability analysis, highlighting how vulnerabilities can be accessed and exploited.
- References:
- Detailed citations such as CVE (Common Vulnerabilities and Exposures) IDs, EPSS (Exploit Prediction Scoring System) data, and CVSS (Common Vulnerability Scoring System) metrics.
- Links to relevant advisories for remediation guidance.
- Component Vulnerability Insights:
- Precise information on vulnerabilities within specific components, including offsets, relative addresses, and handler details.
- Pseudocode representations that illustrate the functionality and potential exploitation paths within the analyzed binaries.
Findings types
Unknown Vulnerabilities
These are zero-day vulnerabilities requiring immediate attention. Unknown Vulnerability Analysis identifies vulnerabilities within specific classes, such as NVRAM variable handling and SMM callouts. The component section details the affected module’s name, hash, GUID Path, AData size vulnerability, and Architecture. Depending on the finding type, additional data may include callout and handler offsets, variable names, locations, and other relevant details. Descriptions are based on triggered rules but are unique to the customer’s environment. Data from Unknown Vulnerability Analysis should be tightly controlled until the finding’s exploitability has been validated or the vulnerability has been mitigated or remediated.Vulnerability Detail
Known Vulnerabilities
Refer to security flaws in software, firmware, or components that have been identified, documented, and assigned identifiers like Common Vulnerabilities and Exposures (CVEs) and, Exploit Predictability (EPSS) . These vulnerabilities are publicized to inform organizations, developers, and security teams to implement appropriate mitigations or patches. Known Vulnerability findings Include extensive detail to help analysts and security Engineers better understand the known vulnerabilities and prioritize mitigation. details provided include the aforementioned industry references, reachability analysis, In-depth component vulnerability detail as well as pseudocode representations of the vulnerability. Here’s an overview of key aspects of known vulnerabilities: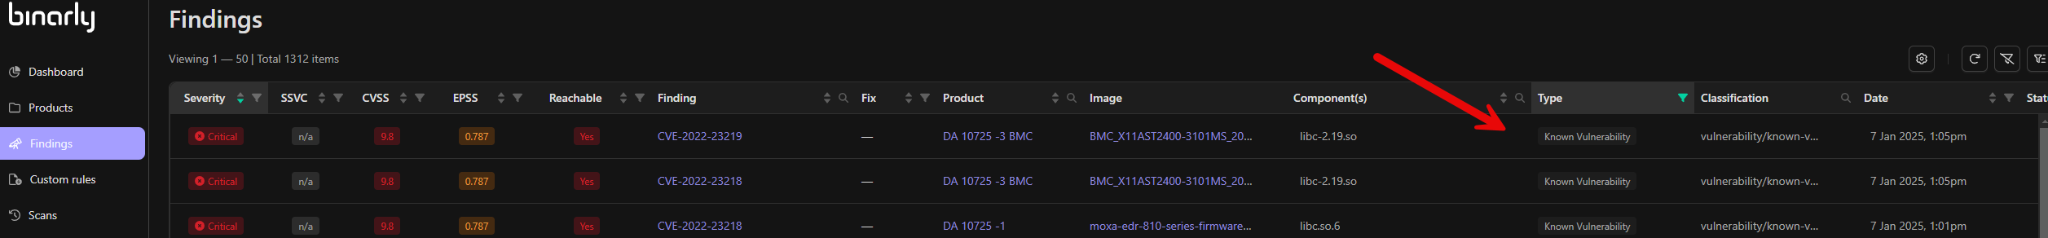
Malicious Code Detection
This involves identifying harmful entities such as malicious implants, hooks, embedded executables, or other anomalies within analyzed images, offering robust security analysis and risk mitigation to businesses. These elements are crafted by attackers to infiltrate, persist, and potentially exfiltrate sensitive data or compromise a system. Malicious code can evade current defense platforms because it blends in with standard functionality and can remain dormant or operate in stealth for long periods of time. The Binarly Transparency Platform identifies the module name and type, then checks for the existence of embedded executables, Malicious Hooks, and their functions, as well as Firmware Implants. Findings provide in-depth details as to the severity, location, and capabilities associated with the detected threat(s) including module type, name, kind or function, Offset (virtual address), and industry references.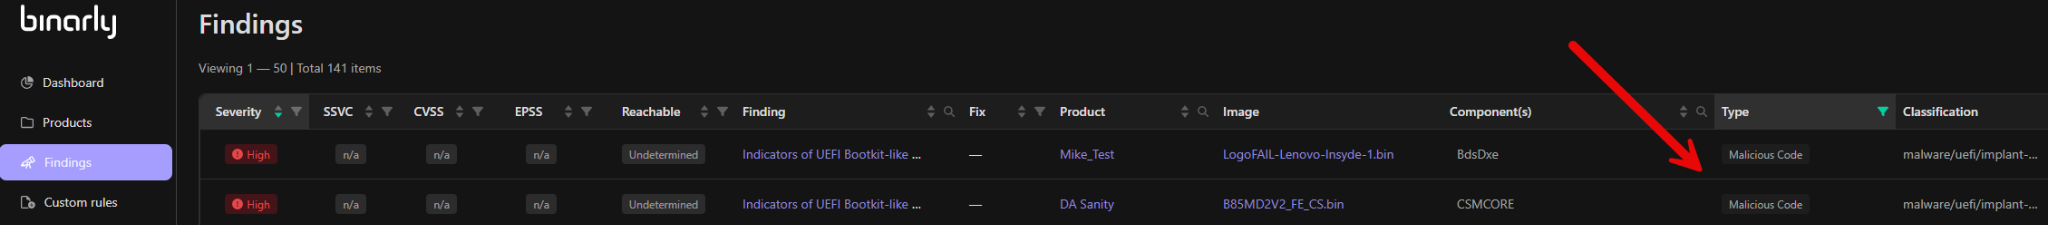
Dependency Findings
Dependency findings focus on identifying vulnerabilities within both direct and transitive software dependencies. These vulnerabilities may arise in open-source libraries or other third-party components utilized in software development, potentially introducing supply chain risks. Dependency vulnerabilities constitute a significant portion of third-party supply chain issues, making it essential to identify vulnerable or potentially at-risk components and subcomponents embedded in software. This is critical for understanding risks that may not be immediately apparent at the application level. Dependency findings include standard industry references such as CVE (Common Vulnerabilities and Exposures), CWE (Common Weakness Enumerations), and CVSS (Common Vulnerability Scoring System). These references are derived from queries to the National Vulnerability Database (NVD) based on key characteristics of the identified components and dependencies. In addition to these references, further analysis enhances the findings with identifiers such as GitHub security advisories, EPSS (Exploit Prediction Scoring System), and CISA references, including Known Exploited Vulnerabilities (KEV) and known ransomware associations. Custom reachability analysis and fix information is also provided for deeper insights and critical prioritization information. Vulnerable component details include attributes such as name, GUID, path, magic strings, and architecture, offering comprehensive context for prioritizing and addressing risks effectively. Dependency references
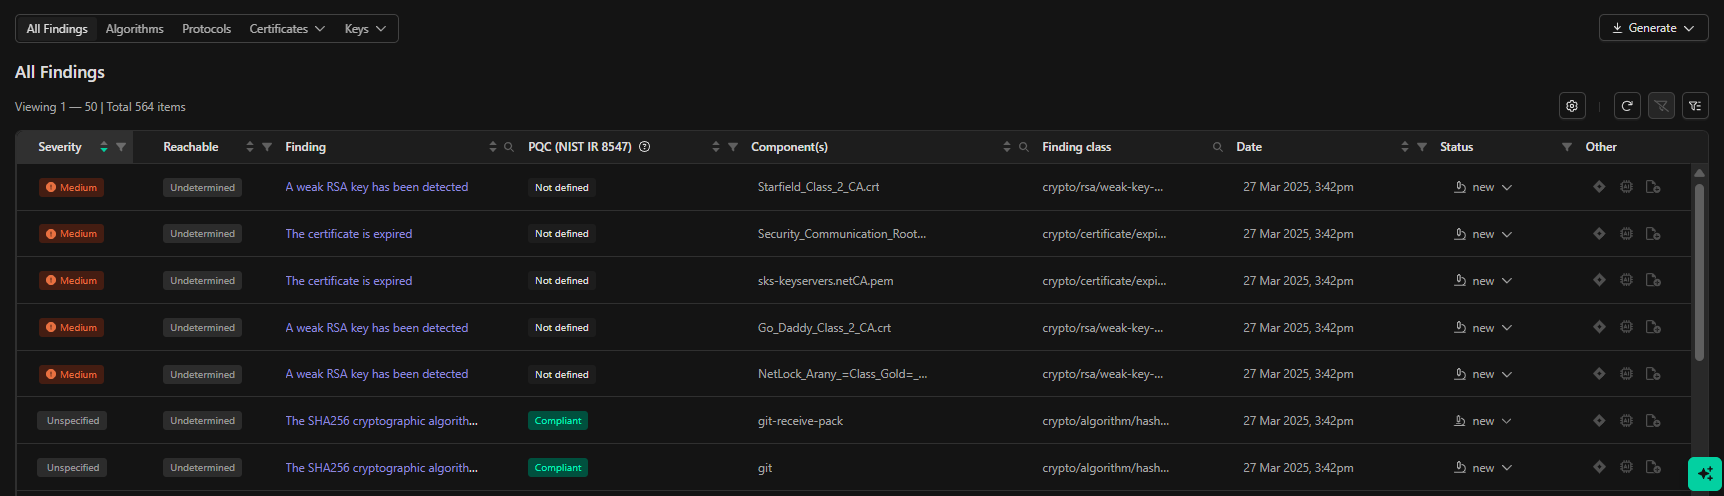
Cryptographic Findings
The Cryptographic Materials tab isolates all detected algorithms, protocols, certificates, and keys discovered in the image. Findings include compliance assessments (weak, deprecated, quantum-vulnerable), certificate parameters, key material details, confidence scores, and reachability analysis. Reports can be generated directly from this tab as a PQC Compliance Report or CBOM export. For a full walkthrough of the tab, see Cryptographic Materials.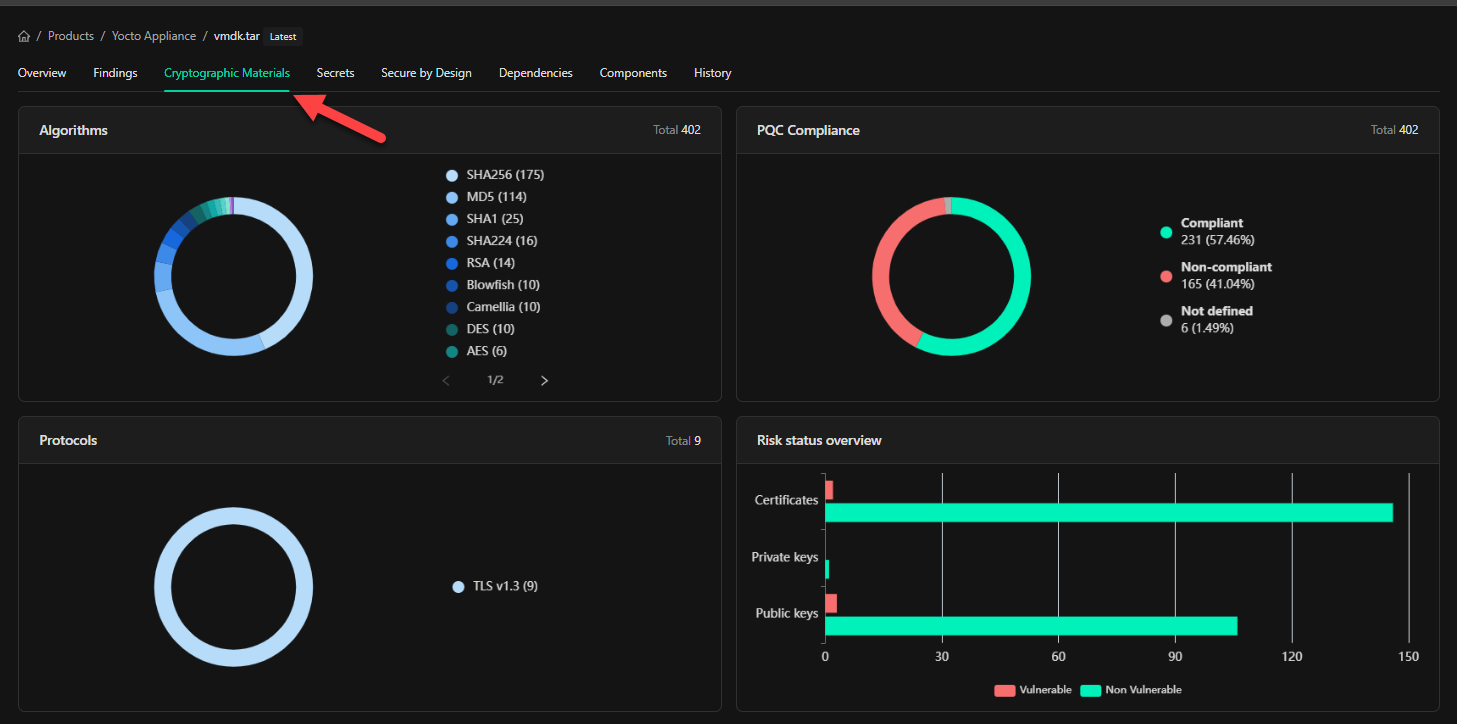
Secure By Design
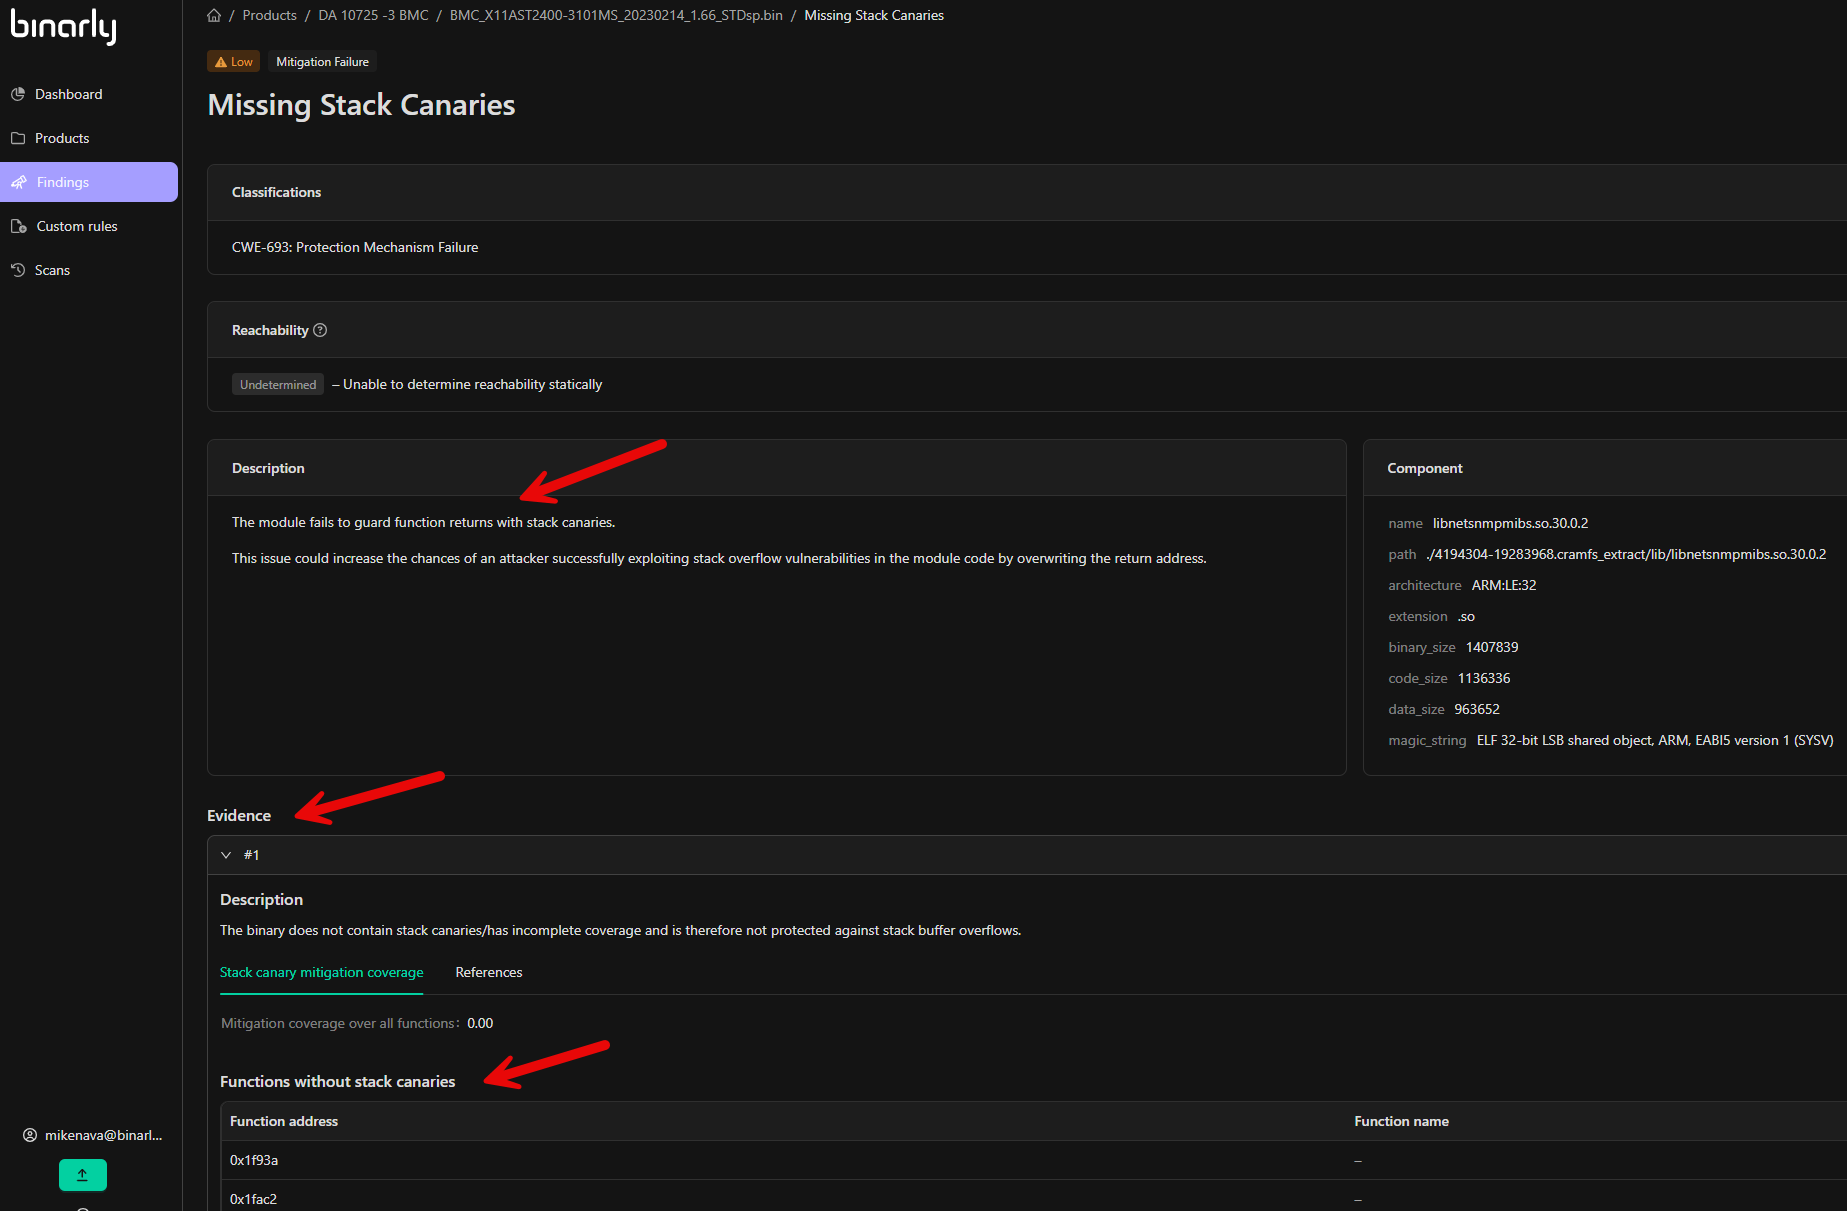
These findings call out risks and issues that can impact the integrity and security of software and hardware supply chains. They typically surface during manufacturing, distribution, or integration and point to deviations from CISA’s Secure by Design guidance and the NIST SP 800-218 secure development framework. Issues are categorized as unsafe functions, mitigation failures, weaknesses, expired certificates, and known exploited vulnerabilities (KEVs). Mitigation & Weaknesses identify misconfigurations or flaws in firmware or software, which could potentially lead to security breaches. The vast majority of these findings are low in severity, as they typically reflect an oversight or failure to implement practices in software development that could enhance or harden the security of the affected components, rather than a vulnerability or threat being present. Examples include usage of unsafe functions and failure to implement protection mechanisms such as RELRO, Stack Canaries, and Control Flow. Finding details for mitigations and weaknesses include classifications that outline Common Weakness Enumerations (CWE), details about impacted components, and specific information about the finding. This may include impacted function lists, associated references, and other relevant contextual data. In this screenshot, we are investigating Missing Stack Canaries.
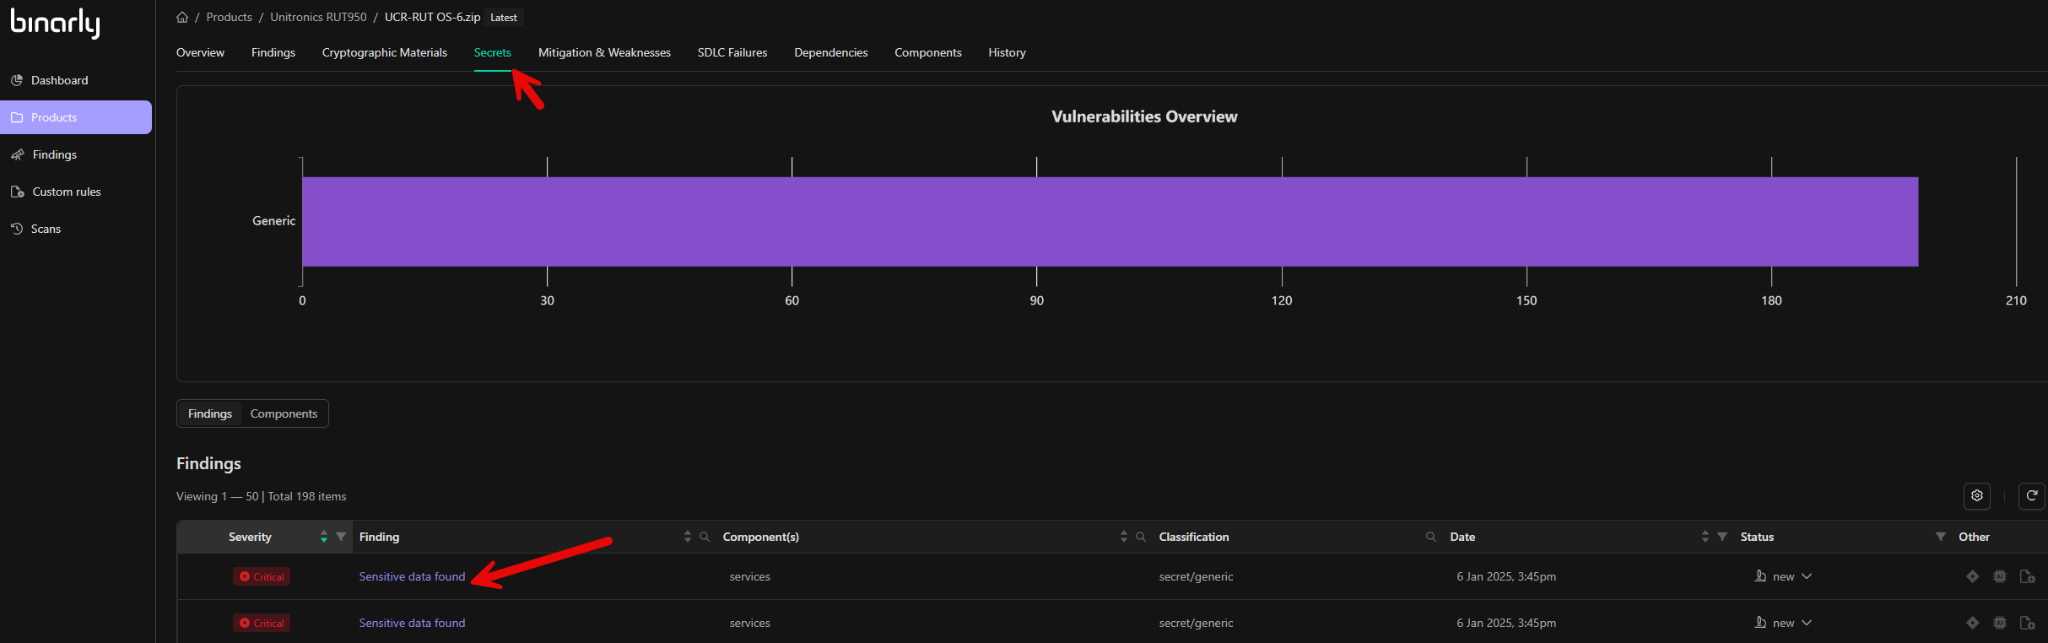
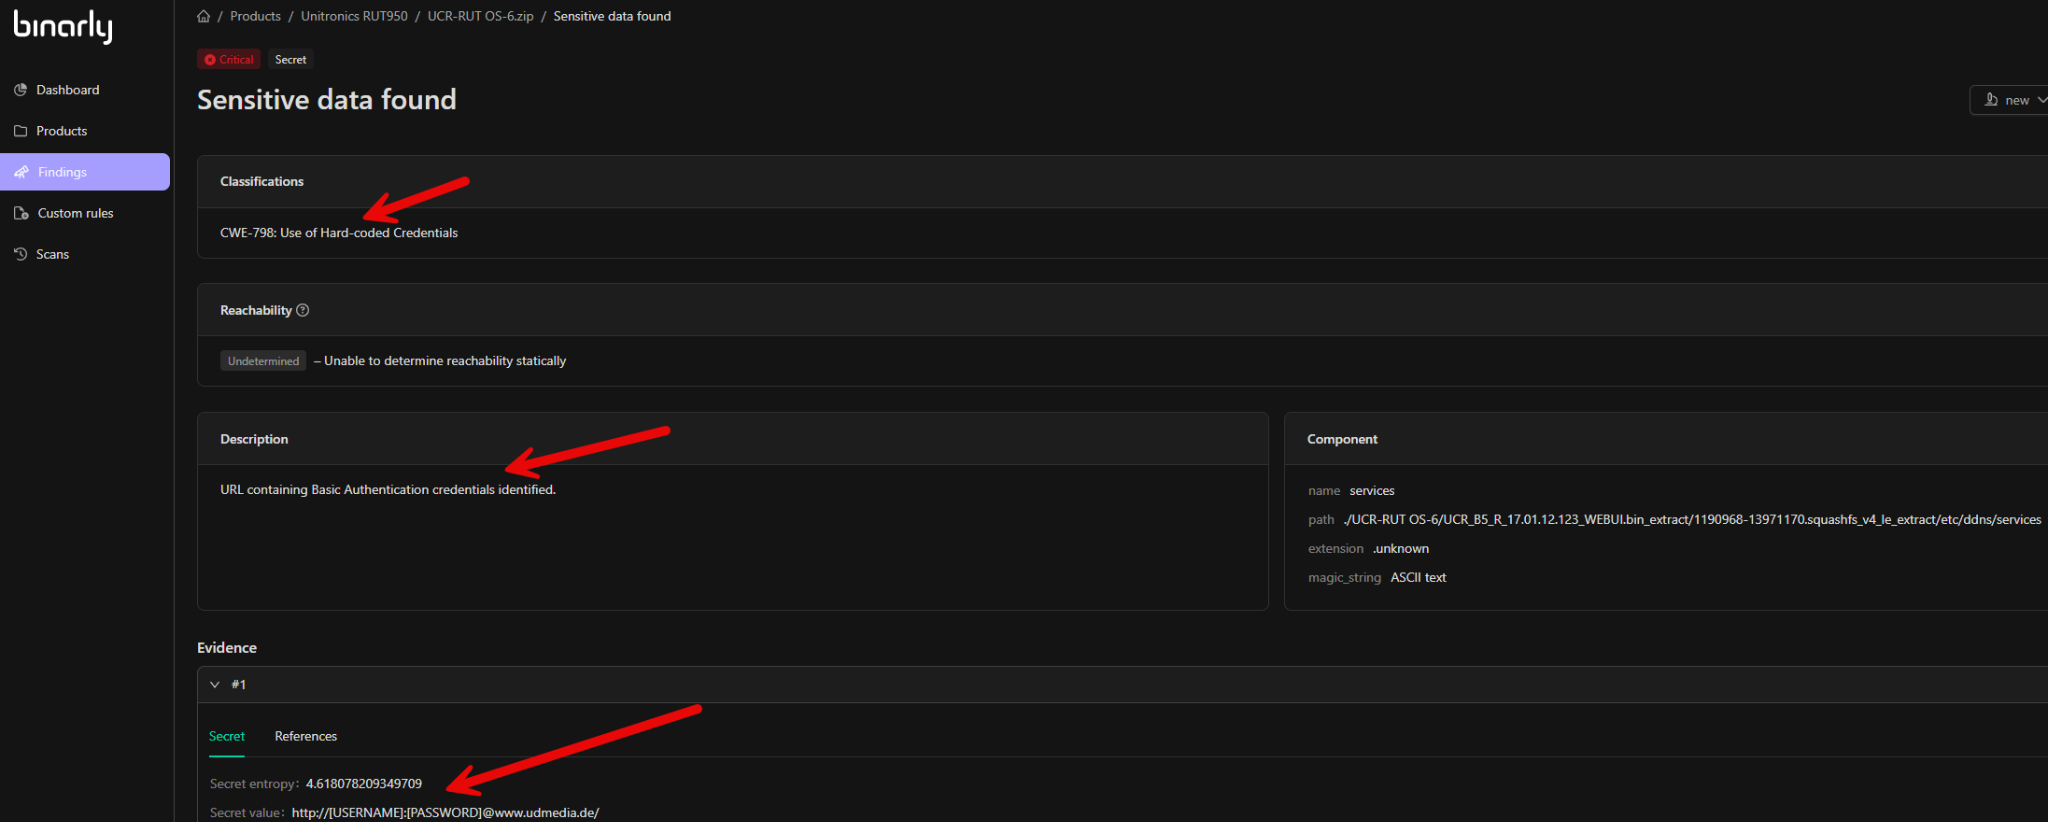
Secret Findings
The platform utilizes regex-based rules to detect hardcoded sensitive information, such as API keys, JSON web tokens, OAuth tokens, encryption keys, or webhook URLs embedded within scripts or files. If exposed, such secrets could be exploited by attackers. While secrets can be identified in any image analyzed by the platform, they are particularly prevalent in Docker containers and embedded Linux firmware. Finding details for secrets include classifications aligned with Common Weakness Enumerations (CWE) and detailed descriptions of the identified issue. Component details specify the location or the specific component, script, or file in which the embedded secret was discovered. Evidence information includes the actual secret value and its entropy, providing a thorough context for addressing the risk. For details on detection scope, input coverage, and secret validation, see Secrets Detection.