Key Features
-
Centralized Overview:
- Displays critical findings and trends from the most recent scans across all products.
- Highlights items requiring immediate attention to streamline decision-making.
-
Dynamic Graphs and Visualizations:
- Presents data in graphical formats for easy interpretation.
- Visualizations reflect the latest or most relevant scans of images, ensuring up-to-date insights.
-
Customizable Views:
- Tailor the dataset by applying filters for specific products, timelines, or other criteria.
- Drill down into graphs to access detailed information about individual findings or trends.
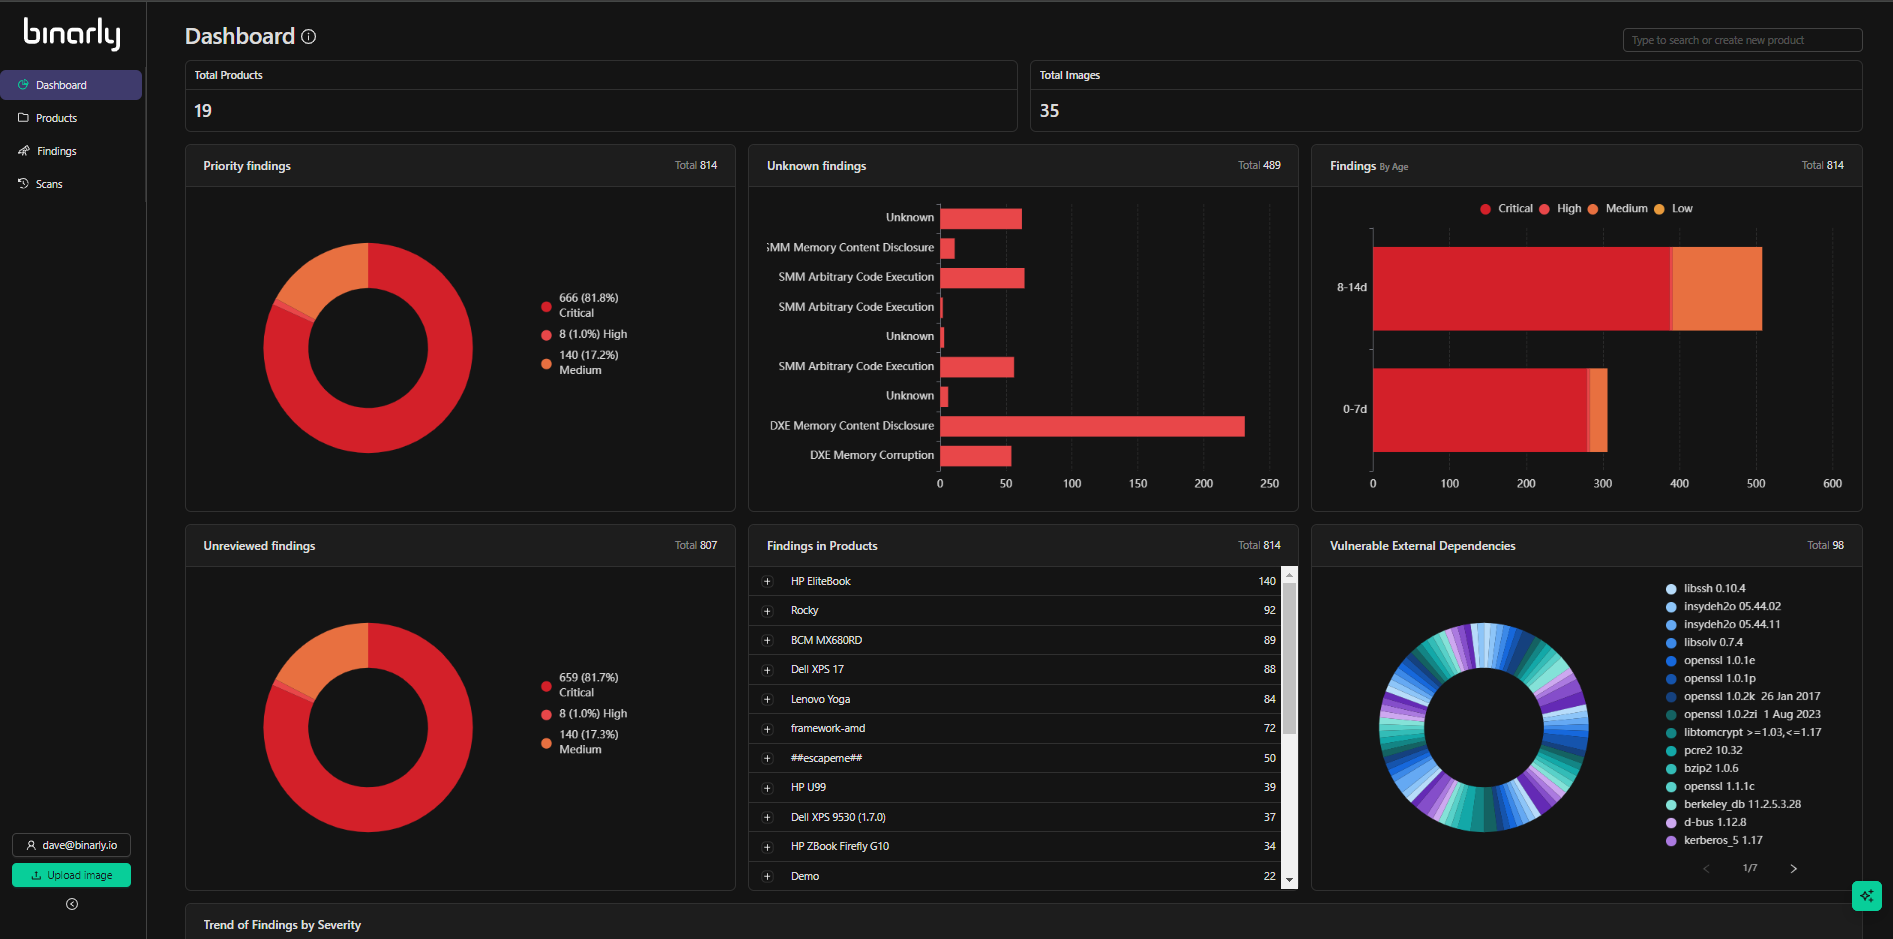
Priority Findings
This graph details the high, critical, and medium severity findings across all products and images. It is designed to highlight the most pressing issues for investigation or remediation. The areas of the graph are interactive and can be used to sort or drill directly into a filtered finding page detailing the graphed data.Unknown Findings
This graph details and lists only unknown vulnerabilities discovered across all products and images. The graph is sorted by class of vulnerabilities, such as DXE Memory Corruption or SMM Memory Content Disclosure. Listed within these classes are the discovered unknown vulnerabilities. Unknown vulnerabilities have not been previously seen before and are technically zero-day. Drilling down into any portion of the graph will take you to a filtered list of the findings sorted by only unknown finding type.Threat Intelligence Monitoring
The Threat Intelligence Monitoring feature continuously tracks newly discovered vulnerabilities and emerging threats across your products. It automatically updates findings with real-time threat data from normalized vulnerability sources, without rescans. The following screenshot shows the Threat Intelligence Monitoring section.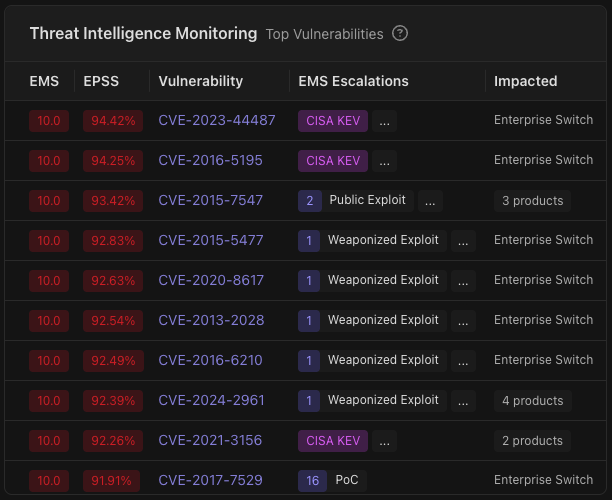
Findings by Age
Findings by age detail findings across all products and images listed by severity and sorted by the time the issues have existed but gone unaddressed or triaged. This representation is designed to provide visibility into the existing windows of risk based on the discovery timeline of the vulnerabilities. The graphs will trend with time and can be positively impacted by review and adjustment of the status of the findings represented in the graphs. Drilling down into the graph will take you to a filtered list of the findings sorted by Scan time ( discovery date) and status.Unreviewed Findings
The unreviewed findings graph details untriaged vulnerabilities by severity within the platform. This representation provides visibility into the remediation, mitigation, and documented review activity on discovered findings. It provides critical insights valuable for resourcing, utilization, and prioritization around the handling scan findings. All findings are marked with a status of new by default. When a Finding status is changed to in progress, rejected , or remediated, it is no longer unreviewed and does not show in this graph. Drilling into the graph will take you to a filtered list of the findings sorted by severity status and scan date.Findings in Products
Product findings offer a high-level visualization of the number of critical, high, and medium-severity vulnerabilities across the corpus of products analyzed by the platform. Expanding the individual products will give a breakdown of vulnerability counts by severity.Vulnerable External Dependencies
The vulnerable external dependencies graph represents a high-level overview of the statically linked and transitive dependencies discovered within the images analyzed by the platform. This important representation provides visibility of the true dependencies and components that make up the firmware, Linux packages, or containers analyzed by the platform. Hovering specific dependency names will provide visualizations of the versioning and counts of this particular dependency. Given this potentially large number of identified dependencies, details are available within each image under the dependencies tab.Trend of Findings by Severity
The finding trend visualization provides a customizable timeline view detailing vulnerability and finding discovery over time listed by severity. This view allows a user to spot and understand trends in discovery, mitigation, or remediation and triage issues. The customizable time frame slider allows closer inspection of particular trends and specific time ranges to understand better build time issues, Image scan events, resourcing, and incident response requirements.General Interface Navigation
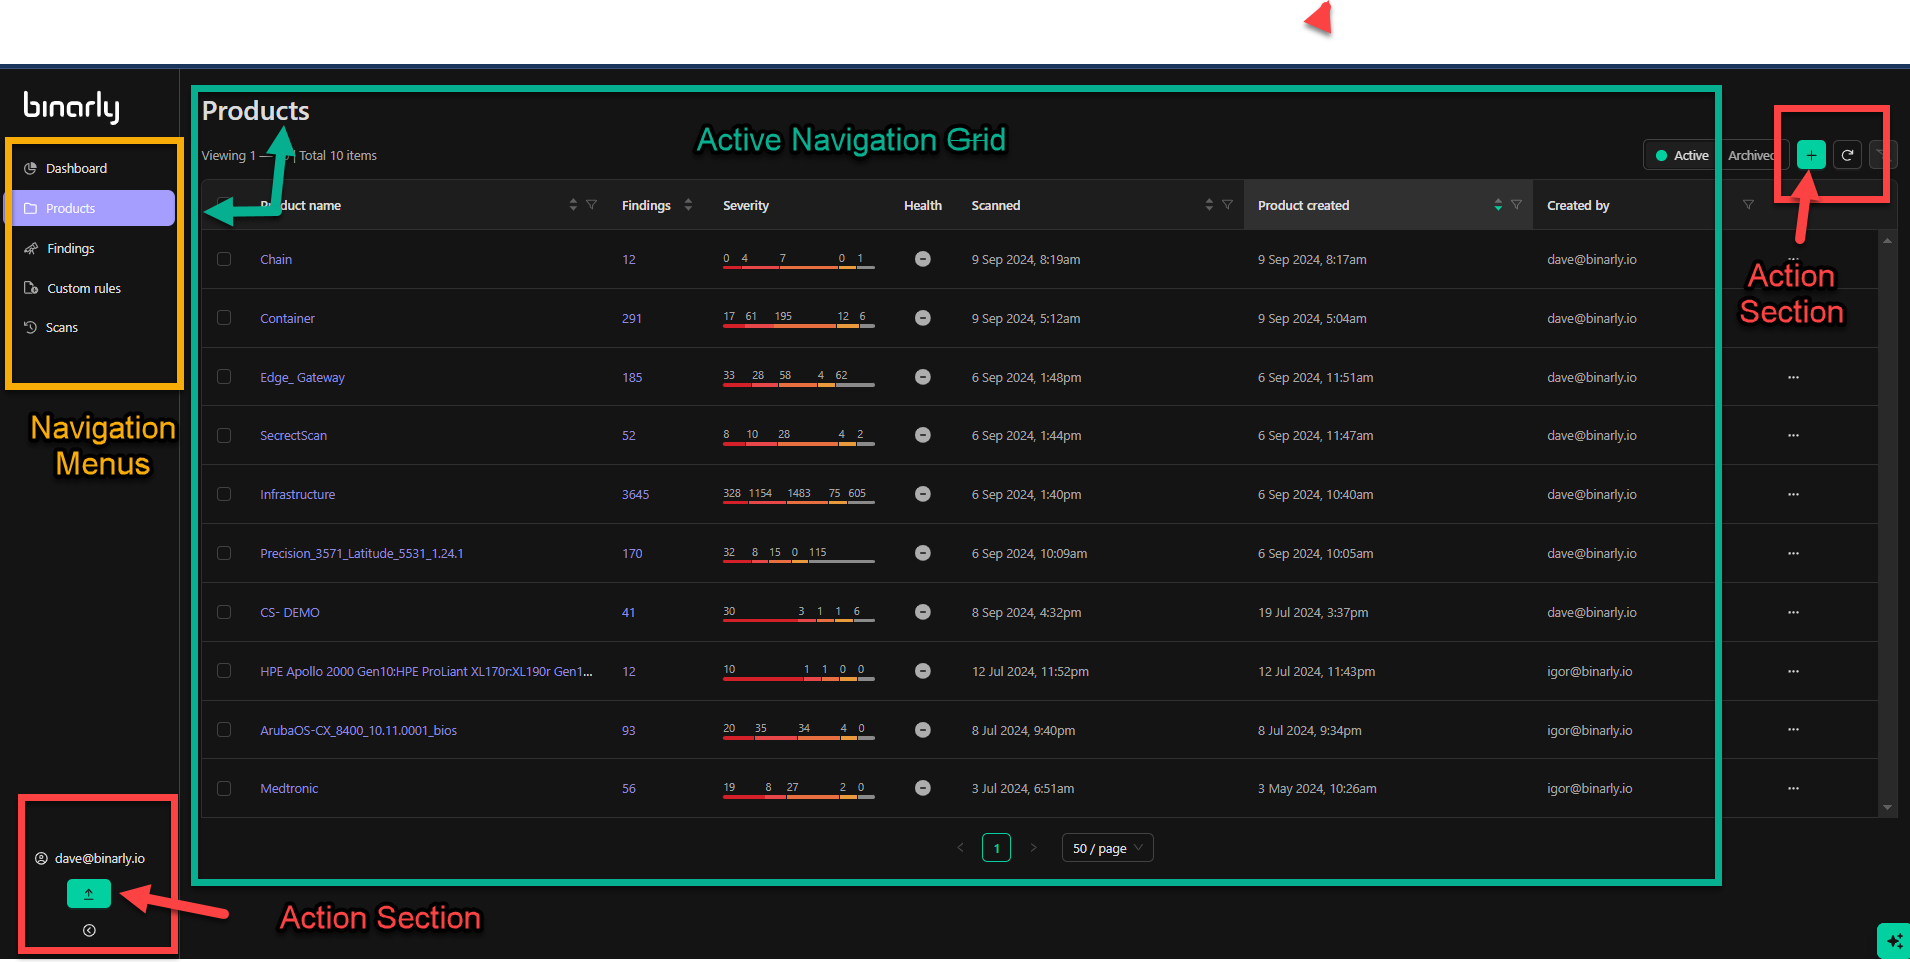
The Binarly Transparency Platform interface is organized into distinct areas to facilitate efficient navigation and interaction. Beyond the dashboard, the interface includes menus, action/configuration sections, and navigational grid views to provide users with a streamlined experience.Menus
- Purpose: Menus serve as the primary navigation tool for accessing the platform’s various capabilities and information.
- Location: Typically located along the top or side of the interface.
-
Functionality:
- Direct access to key features such as Products, Findings, and Settings.
- Easy switching between different sections of the platform.
Action and Configuration Sections
- Purpose: Allow users to interact with the platform by managing views, filters, and uploads.
-
Locations:
- Bottom Left: Tools for creating new products or uploading images.
- Upper Right: Options to reset filters or change views.
- Dynamic Behavior: The available actions adjust based on the current platform view, ensuring context-appropriate options.
Navigational Grid Views
- Primary Views: Products, findings, and scans are displayed within grid views designed for efficient review and management of information.
-
Key Features:
- Customizable Columns: Tailor the grid to display only the information most relevant to your needs.
- Paginated Display: By default, grids show 50 items per page, with pagination options at the bottom center of the interface. Users can adjust the number of items displayed per page based on their preference.
- Organized Presentation: Grids are structured to provide a clear and concise overview of data at a glance.
- Action-Specific Columns: Columns and available actions vary depending on the grid you are viewing, ensuring the interface is tailored to the task at hand.